
Lab 6: On-Device Debugging with Workbench
This page is no longer maintained and is provided for historical reference only
| Project Goal | Perform on-device debugging with Particle Workbench and the Particle Debugger. |
|---|---|
| What you’ll learn | How to create debug builds in Workbench; step-debugging in Workbench |
| Tools you’ll need | A Particle Argon, and the Grove Starter Kit for Particle Mesh, a Particle Debugger. |
| Time needed to complete | 30 minutes |
So far in this workshop, you've used the USB Serial interface to inspect and debug the current state of our devices with Serial.print() statements. And while this approach is handy for quickly inspecting the state of a running application, Particle provides first-class on-device debugging support with Particle Workbench.
In this section, you'll explore using Particle Workbench to step-debug your Particle-powered app.
Prepare for debugging
In order to perform step debugging and a few other features, you'll need to disable BLE support in your application firmware. This is to address a current limitation in software that Device OS depends on to handle real-time networking and communication.
At the start of your setup function, add the following lines to disable BLE during debugging. The #if preprocessor ensures that these commands are only compiled into the binary if you're running a debug build.
  #if defined(DEBUG_BUILD)
  BLE.off();
  #endif
Now, continue onto the next step. When you flash a debug build to your device, you'll automatically disable BLE so you can perform step debugging.
Connect the Particle debugger
To complete this portion of the lab, you'll need the following:
- Particle Workbench
- The trusty Argon you've been using for other parts of this lab
- One Particle Debugger
- A free USB port on your laptop
The Particle Debugger is an accessory that attaches between your computer (via USB) and your Particle device and allows for in-circuit debugging. To do this the Argon must be connected to the same computer via Micro USB at the same time, so make sure you have enough ports available. If your laptop has only USB C ports available, you'll need an adapter that converts USB-C to USB-A.
Connect the debugger to the debug port on your Particle device using the ribbon cable that comes with your debugger. Then, plug the debugger and your Argon into your computer.
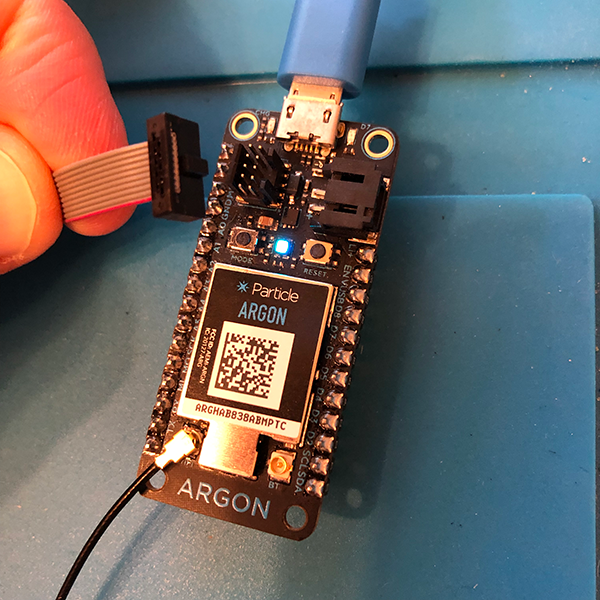
Tip: Know your way around the Particle Debugger
The Debugger comes with a ribbon cable that's used to connect between it and the device you want to debug. The debugger cable is wider than the pins is notched to ensure proper connection between the devices.
On your debugger this port is located opposite the USB connector. On your Argon, the debugging port is located across from the LiPo battery connector.
Create a debug firmware binary
Once everything is connected and powered on, you’ll need to put your Particle device into Device Firmware Update (DFU) mode.
In order for Workbench to facilitate on-device debugging, it needs to compile and flash a debug build of your application and the Particle Device OS firmware in a single binary.
You’ll sometimes see this referred to as a monolithic build because this differs from the normal build process, where Device OS and your application firmware can be updated independent of one another.
To put your device in DFU mode, press and hold the
MODEandRESETbuttons on the device. Then, release theRESETbutton, while continuing to hold theMODEbutton until the RGB LED on the device starts blinking yellow.
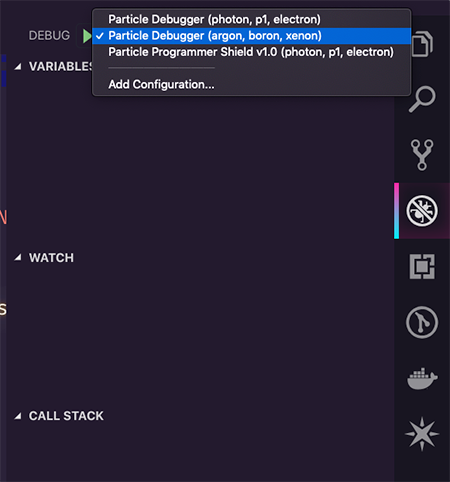
- Now that you’re setup on the hardware side, let’s start a debugging session and cover some Workbench basics. Make sure your project from this workshop is open in Workbench. Click the bug icon in the VS Code / Workbench sidebar to open the debug sidebar.
Click the debug configurations dropdown and select the Particle Debugger (Argon or Boron) option.
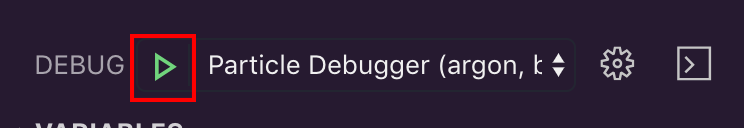
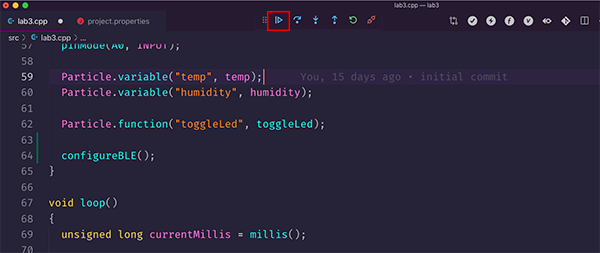
Finally, click the green arrow next to the debug configuration dropdown to initiate the debug process.
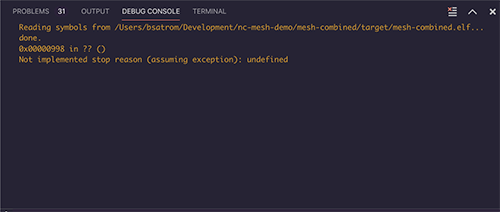
Now, get ready to wait a bit as Workbench creates a debug binary for your project. This will go much faster on repeat runs, but the first run is a good time to grab a cup of coffee, take a stretch break, or practice your sword-fighting in the hallway.- Once the debug binary is built and flashed to your device, Workbench will halt and your device will power down. If you're watching the onboard RGB LED closely, you'll notice it will turn off. You should also see the following message in the Debug Console — which is expected.
- Click the continue button to power your device back up. Once your Argon is breathing cyan again, you’re ready to debug!
Step-debug your device with workbench
Setting breakpoints and stepping through code
- Let's start with one of the most commonly-used debug features: setting breakpoints. This allows you to pause and inspect the state of running code during execution. You can set breakpoints by clicking in the gutter next to an individual line, or from the Breakpoints section of the debug sidebar.
- Click on the gutter next to the line that reads the current temp from your device. When a breakpoint is set, a red circle will appear next to the line on which to break.
- Since you set your first breakpoint inside of the
loop, it will be hit automatically after the interval period passes. You'll know that execution is paused because the line you set a breakpoint on will be highlighted in yellow and an arrow will appear in the gutter next to that line.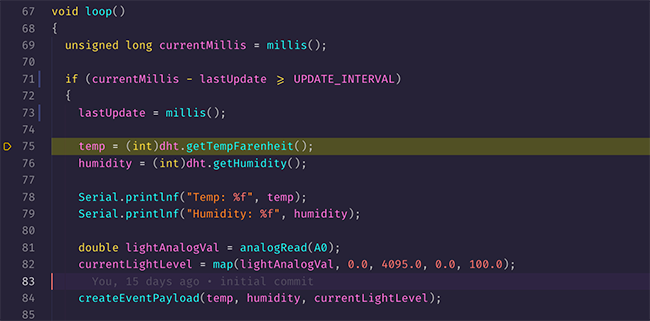
- Once a breakpoint is hit, the line in question will be highlighted in yellow. From here, you can use the Debug menu at the top of the screen to step through your code.
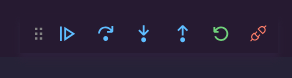 From left to right in the image below, those buttons allow you to continue, step over the current line, step into the current line, step out of the current scope, restart the debug session (you’ll need to put the device back in DFU mode for this to work) and finally, to disconnect the session.
- Press the continue button. Your project will resume execution and break again on the same line after the interval delay elapses.
- It's also possible to only break code when a condition you define is met. Start by setting another breakpoint a few lines later on the
createEventPayloadline. - Right click on the gutter next to that line and select the "Add conditional breakpoint" option.
- In the expression window that expands under the line you selected, you can enter a simple expression to evaluate each time this line is reached. When the expression evaluates to true, the breakpoint will halt execution. Otherwise, execution will continue as normal. Enter the expression
temp > 68and hit Enter.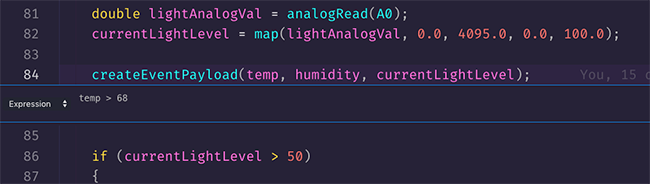
- Hit the continue button again. This time, execution will stop on your conditional breakpoint. Try changing the conditional value to
temp > 90and hit the continue button again. Observe that, this time, the breakpoint is not hit.
Inspecting variables
In addition to step-debugging to inspect the execution of our apps, you'll often want to inspect the state of certain variables and objects. Workbench provides two ways to do this: Either by hovering over a variable in the code window, or by viewing variables in the Variables panel of the debug sidebar.
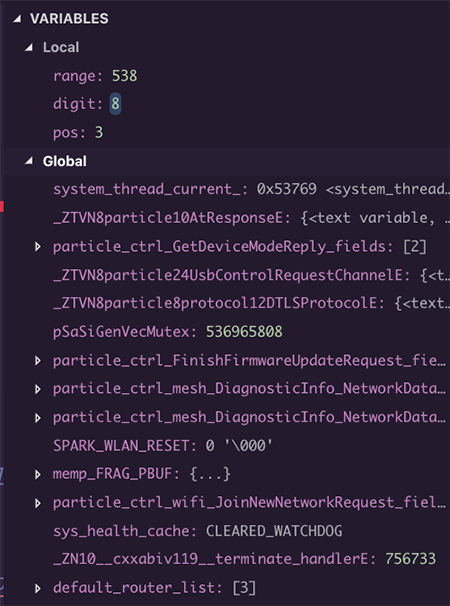
- While debugging and paused on any line, hover your mouse over the
currentLightLevelvariable. A tooltip will appear showing the current value of the variable. - To view all variables, expand the "Variables" panel of the debug sidebar. This panel shows information about all local, global and static variables currently in scope at the point of execution.
Watching variable values
Beyond inspecting local and global variables, you can use the watch panel to tell the debugger to keep track of the state of a given variable or object. This can be quite useful if you want to see how a portion of your application mutates or is affected by another variable, or if you want to take a closer look at when a given variable or object comes into or goes out of scope as your app is running.
- To watch a variable, expand the Watch panel of the debug sidebar. Click the + symbol, and add
jwin the expression box.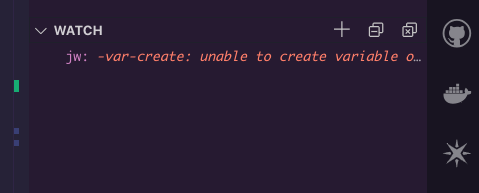
- Now, add a breakpoint to the first line in the
createEventPayloadfunction, which creates theJsonWriterStaticobject.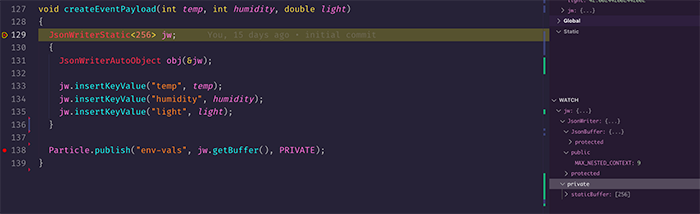
- Start (or continue) debugging until you reach the breakpoint you just set. Hit the step-over icon (second from the left) and watch how the
jwvalue in the Watch window changes. - Hit the step-over icon a few more times until you reach the end of the
createEventPayloadfunction, and observe how the Watch value changes.
Navigating the call stack
Finally, let's look at using the debugger to navigate the call stack.
- Start by adding the breakpoint to the first line of the
toggleLedfunction. If you've stopped debugging, restart and continue until your device is breathing cyan.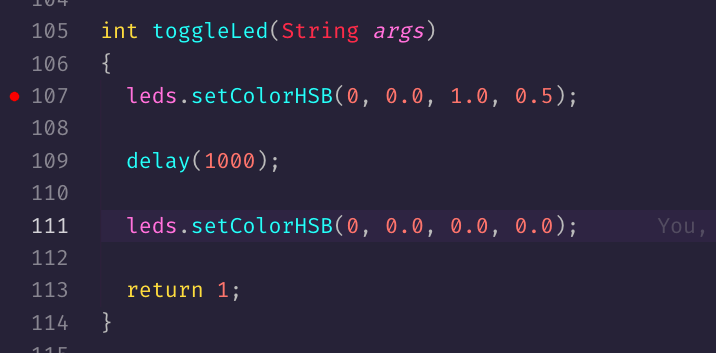
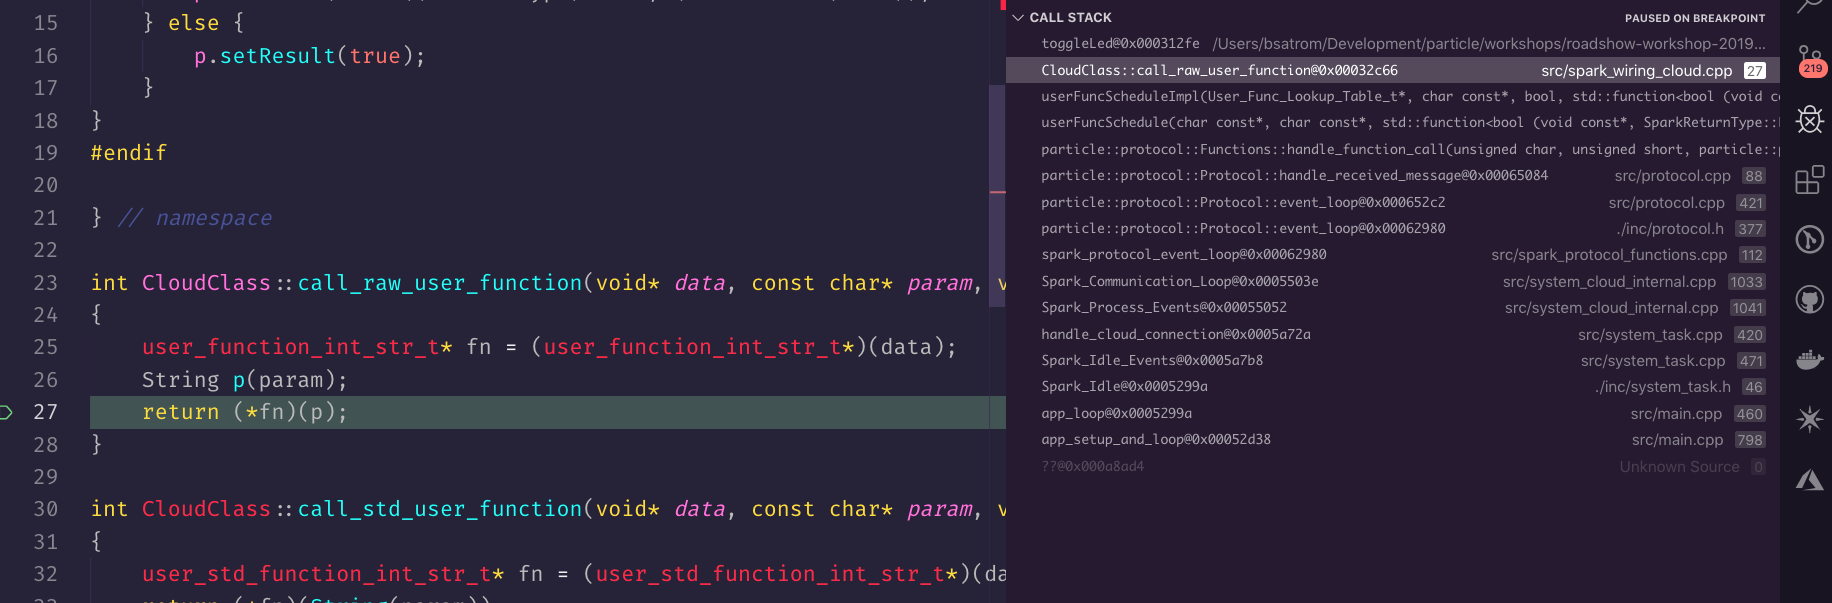
- Open the console and call the
toggleLedCloud function using theCallbutton on your device dashboard screen. The breakpoint you set on thetoggleLedfunction will be hit shortly after you call the function. - Expand the Call Stack panel of the Debug sidebar. This view shows you the entire call stack for your application, from the Device OS logic that handled calling your function, all the way up to the main program loop. You can click on any item in the stack list to view the source and current execution location of the program.
Advanced debugging features
In addition to the features covered in this lab, the Workbench debugger provides access to several debug features built-in to VS Code and leveraged by the cortex-debug extension, including the ability to inspect and edit hardware registers, peripherals, and even direct memory locations.
All of these are outside of the scope of this workshop, so check out the docs for these tools to learn more about how to use them.
Stepping out of the debug cycle
Once you’re done debugging and ready to resume normal coding and flashing, you’ll need to get your device out of its debug state, meaning that you want to replace the monolithic debug build with the hybrid application and device OS firmware.
To do this, put the device back into DFU mode and run the Particle: Flash application & DeviceOS (local) command in the Workbench command palette.
And if you ever run into weird errors while debugging or flashing, the Workbench clean commands are your friends! In our experience, when these things pop up, running Particle: Clean application & DeviceOS (local) and Particle: Clean application for debug (local) are usually enough to set things right again.
Congratulations! You've completed this workshop. Now you're a Particle Master! Take a moment to pat yourself on the back and bask in your newfound IoT-commandery.