
Lab 5: Introducing Particle Integrations & IFTTT
This page is no longer maintained and is provided for historical reference only.
The IFTTT integration has been discontinued and is no longer available.
| Project Goal | Use a Particle Webhook and IFTTT to push device data into Google Sheets. |
|---|---|
| What you’ll learn | How to configure Particle webhooks; Connecting Particle to other services via IFTTT; Building data visualizations in Google Sheets based on device data |
| Tools you’ll need | A Particle Argon, and the Grove Starter Kit for Particle Mesh, an IFTTT account, and a Google account. |
| Time needed to complete | 40 minutes |
Setting up an IFTTT integration
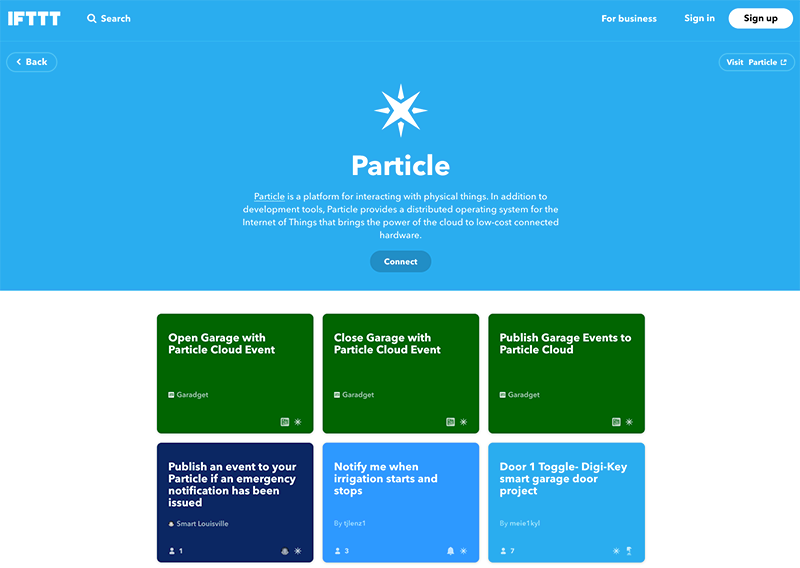
IFTTT (If This, Then That) is a web-based service that allows you to create integrations via simple conditional statements, called applets. There are hundreds of pre-built services you can leverage, and first-class support for Particle devices. In this section, you're going to create an IFTTT integration that posts a tweet when you press a button on your badge.
Note: Before you begin
During the flow below, you'll need to connect both your Particle and Google accounts with IFTTT. When prompted, follow the on-screen instructions to do so.
- Start by heading over to IFTTT and either login, or create a new account.
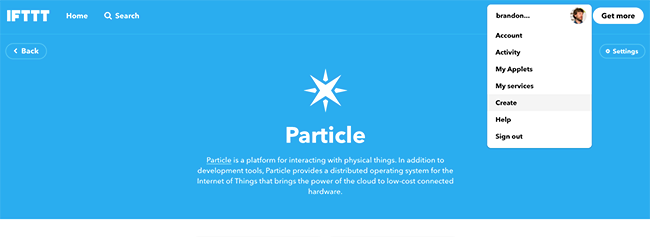
- After logging in, click your profile picture in the top right of your dashboard and select the Create menu option.
- Click the +This button.
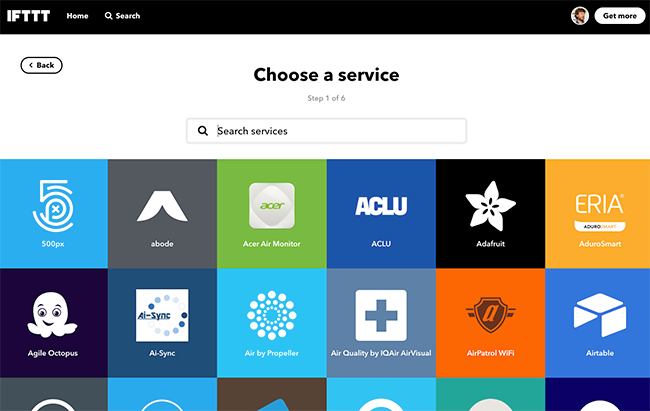
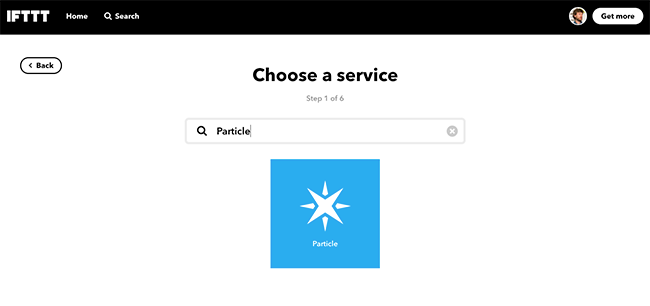
- In the Search services input, type particle and click on the Particle card.
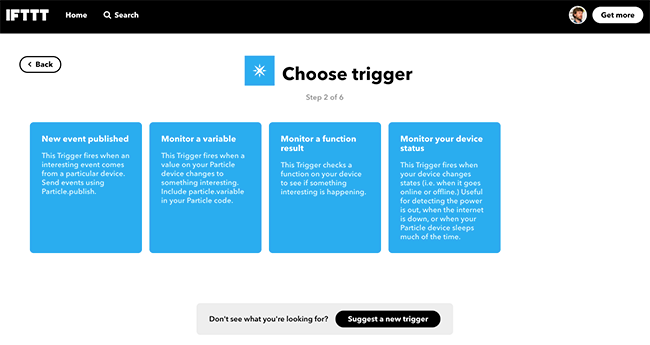
- Click on the New event published card.
- In the trigger fields, set the event name as
env-vals, leave the Event Content field blank and set the Device Name to the name of your device. Click create trigger.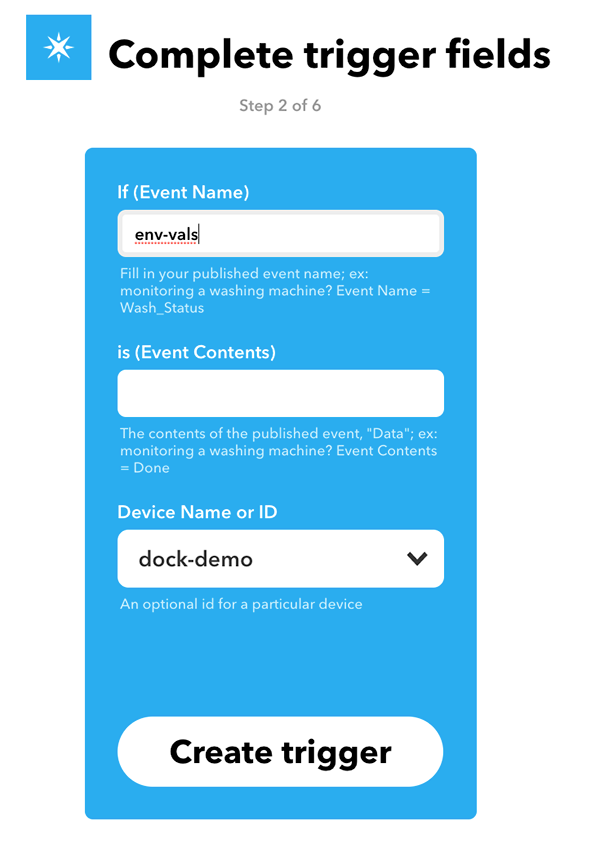
- You've set-up the trigger on the Particle end, now its time for the That+ portion of the setup. Click the +That button.
- In the "Search services" input, type Google Sheets and click on the Google Sheets card.
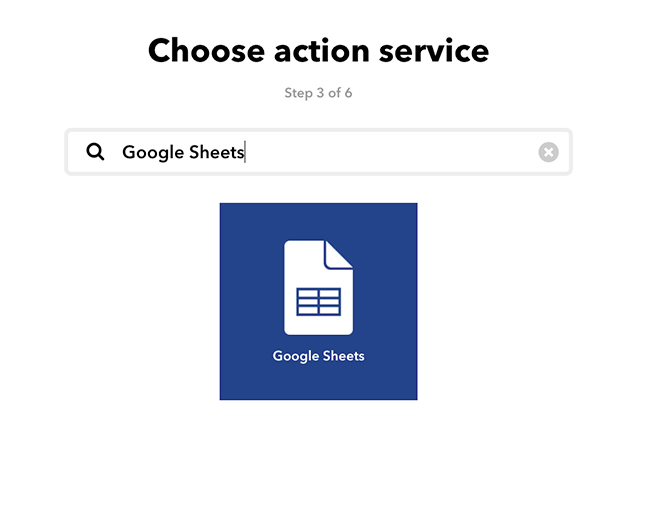
- Click on the Add row to spreadsheet card.
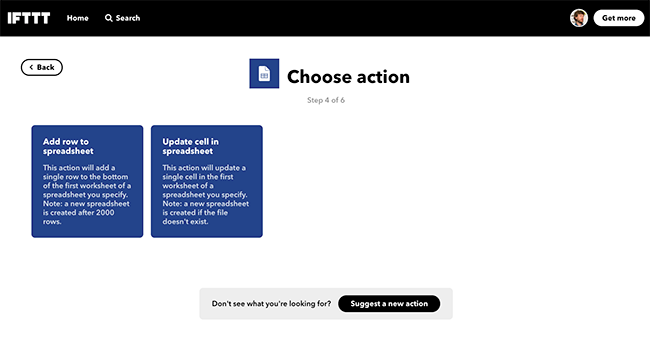
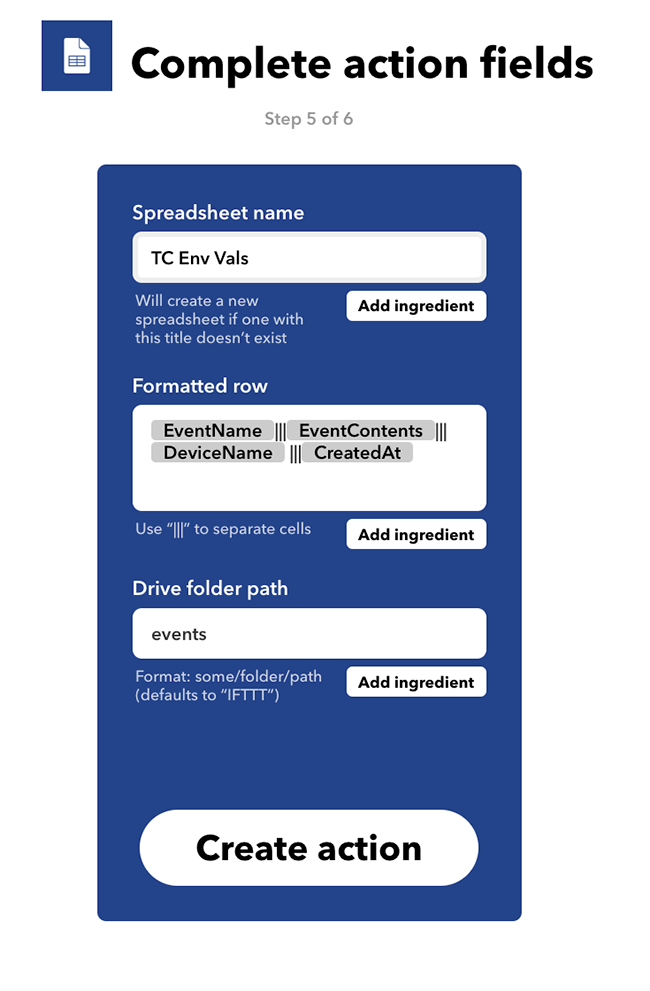
- In the action fields, set the spreadsheet name to TCEnvVals. Leave the defaults in the other fields and click Create action.
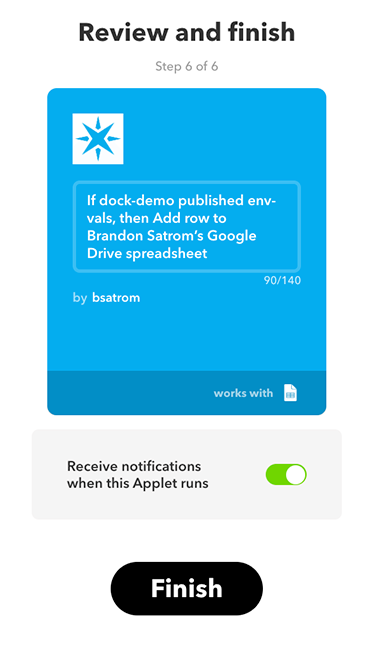
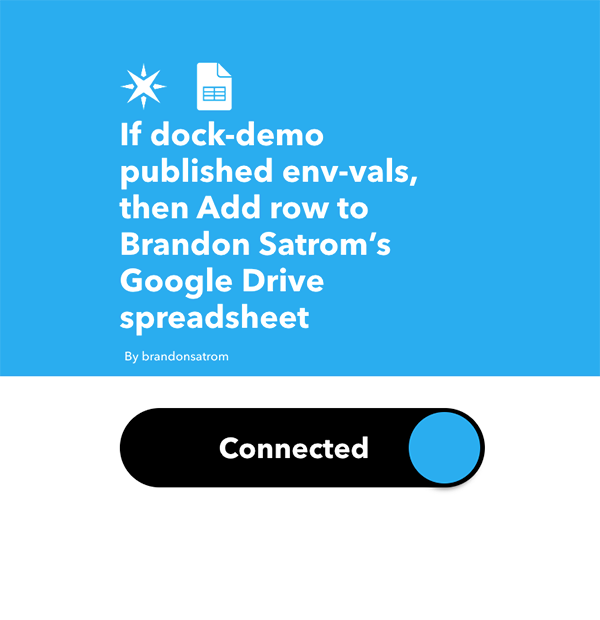
Click the Finish button to create your applet.
Now, let's modify our device firmware to publish temp and humidity values.
Publishing a payload with temp and humidity values
Now, let's send the current temp, humidity and light level using a Particle.publish event. You'll send a single event with all three values in a single JSON object. To do this, you'll use the JSONParserGenerator library.
- Open the Workbench Command Palette (CMD+SHIFT+P or CTRL+SHIFT+P) and select the Particle: Install Library option.
- In the text box, type
JsonParserGeneratorRKand click enter. At the top of your project, add an include statement:
#include "JsonParserGeneratorRK.h"Add a new function to your app called
createEventPayloadthat takes the temp, humidity and light readings.
This function will create an instance ofJsonWriterStaticandJsonWriterAutoObjectobjects, insert key-value pairs for each reading, and then get the JSON object as a string buffer that you can send along in aParticle.publish()event.void createEventPayload(int temp, int humidity, double light) { JsonWriterStatic<256> jw; { JsonWriterAutoObject obj(&jw); jw.insertKeyValue("temp", temp); jw.insertKeyValue("humidity", humidity); jw.insertKeyValue("light", light); } }- Now, let's publish a new event, and call the
createEventPayloadfunction to provide a formatted JSON string for the data parameter. Add the following to the end of yourcreateEventPayloadfunction.Particle.publish("env-vals", jw.getBuffer(), PRIVATE); - Finally, your
loopfunction, call thecreateEventPayloadfunction you just created.createEventPayload(temp, humidity, currentLightLevel);
Posting sensor values to Google sheets
Flash this firmware to your device and navigate to the Particle console. Every few seconds, you'll see a new
env-valsevent show up.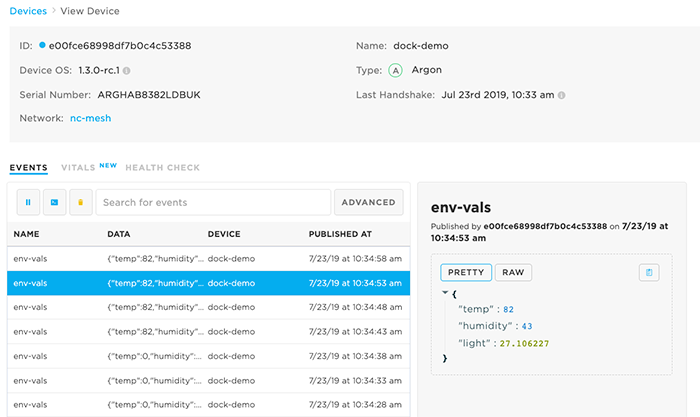
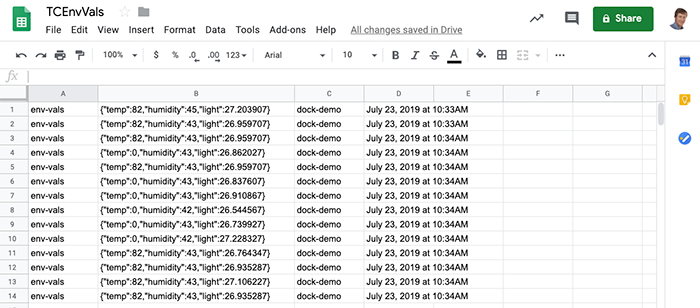
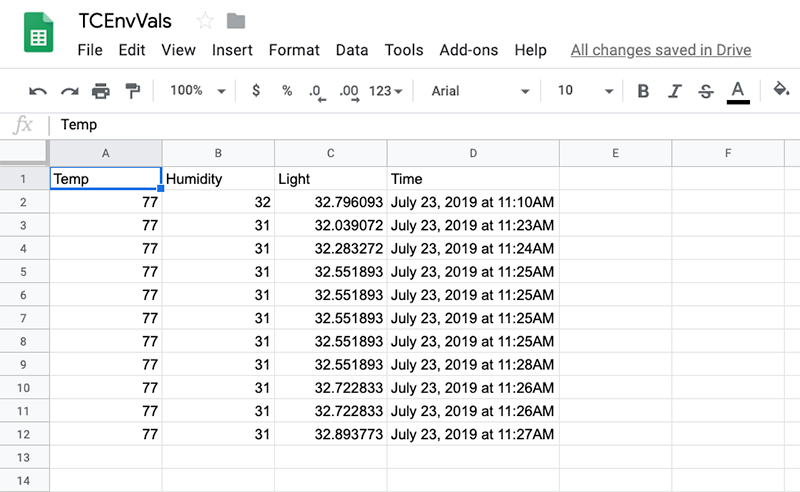
- Open Google Drive and look for a folder named events. In that folder, you'll find a Sheet called TCEnvVals. Open it, and you'll see a row for each event published by your device:
Now that you have data streaming into Google Sheets, let's transform the data and create some simple visualizations!
Processing data in Google sheets
Before you create data visualizations with our sensor data, you need to transform the sensor values into discrete values. You'll do this by creating a simple script that processes the raw data as it is added to the main sheet, inserting each raw sensor value in a new sheet for data viz.
- In the TCEnvVals document, create a new sheet called Processed and give it four columns,
temp, humidity, light, and time.
- In the Tools menu, click the Script Editor option, which will open a new tab with the Google Apps Script editor.
- Click on the Untitled project text and give the project a name, like ProcessTCSensorData.
Remove the default function code and add an
onChangeevent with the following code.function onChange(e) { var row = SpreadsheetApp.getActiveSheet().getLastRow(); var envVals = SpreadsheetApp.getActiveSheet().getRange("B" + row).getValue(); var time = SpreadsheetApp.getActiveSheet().getRange("D" + row).getValue(); var envObj = JSON.parse(envVals); if (envObj.temp != '0') { var ss = SpreadsheetApp.getActiveSpreadsheet(); var processedSheet = ss.getSheetByName('Processed'); processedSheet.appendRow([envObj.temp, envObj.humidity, envObj.light, time]); } }The code above is a JavaScript function that uses the Google Sheets API to get the last row inserted into the main sheet, extract the sensor vals, and the timestamp. The sensor vals are parsed into a JSON object, and then you add a new row to the "Processed" sheet with those values and the timestamp.
- Save the file.
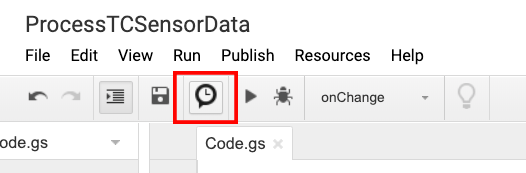
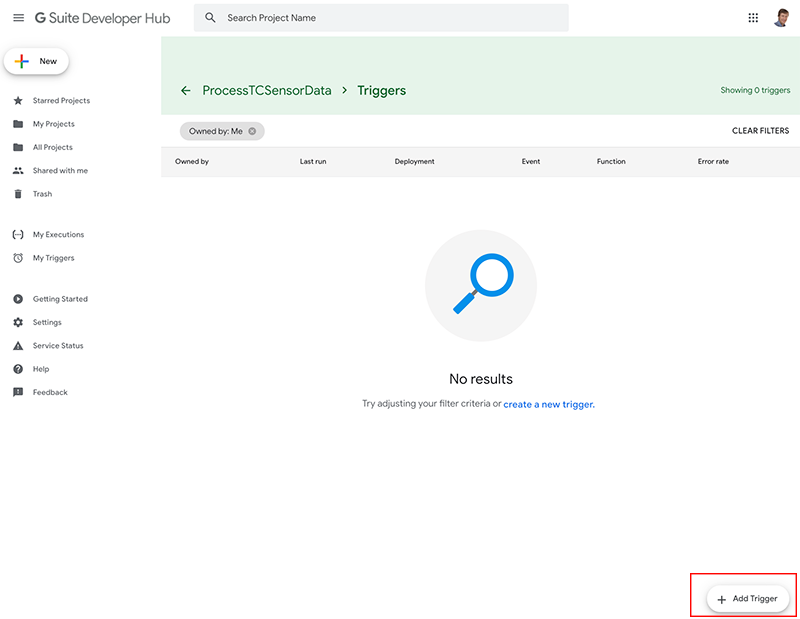
- Now, you'll need to add a change trigger to this app. Click the clock icon to open the triggers for this project.
- Click Add Trigger at the bottom left.
- In the trigger window that opens, make sure that
onChangeis selected as the function name, and On change is selected as the event type.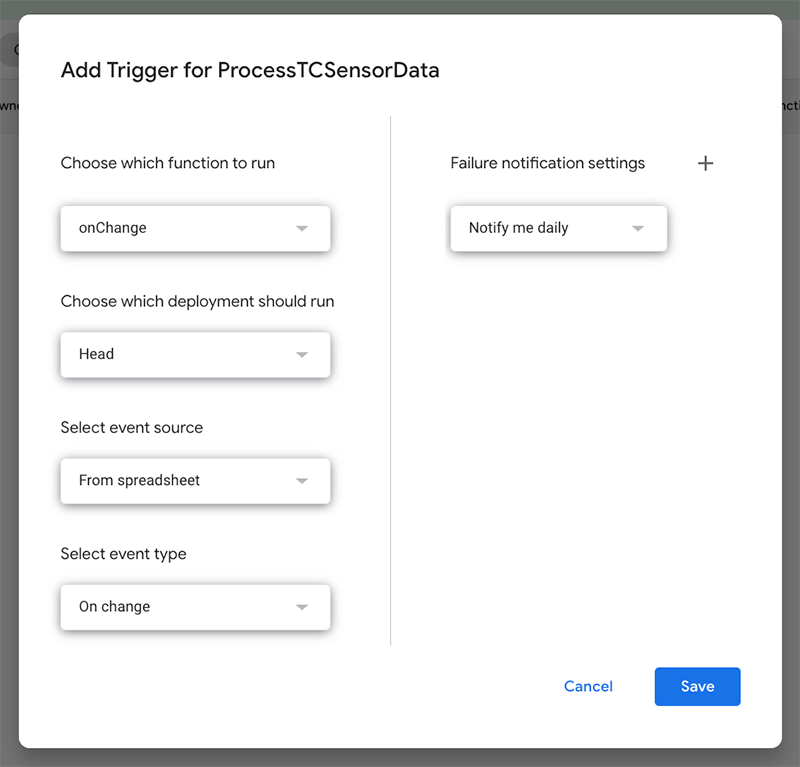
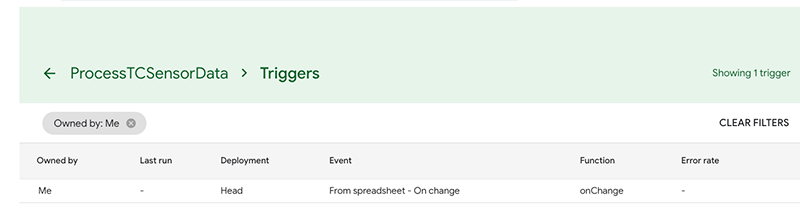
- Click save to create the trigger. You'll be asked to sign-in with your Google Account and grant access to your app. Follow the on-screen instructions to do so.
- In the tab for your spreadsheet, select the Processed sheet. After a few moments, records should start coming through.
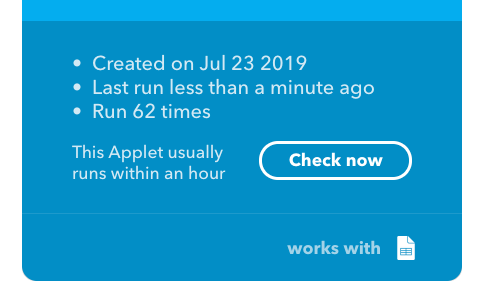
 If you're not seeing anything after a bit, you can click the "Check now" button in your IFTTT Applet.
Visualizing data with Google sheets
Once you have some processed data, you can add a chart to your sheet!
- Create a new tab called DataViz.
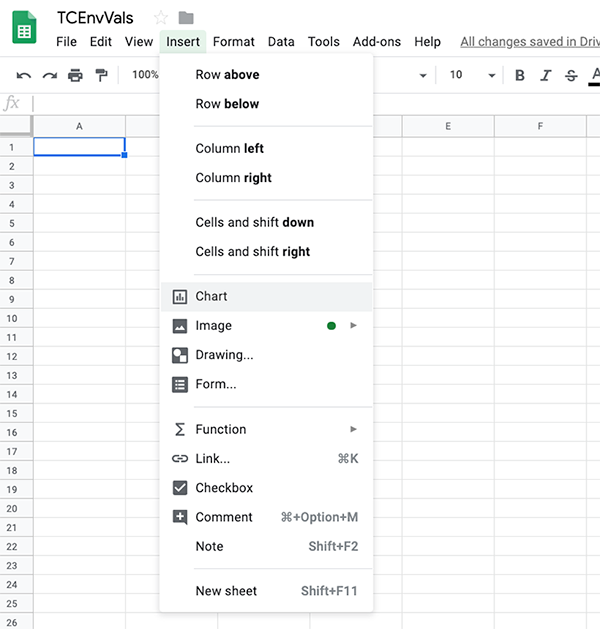
- Click the "Insert" menu and select Chart.
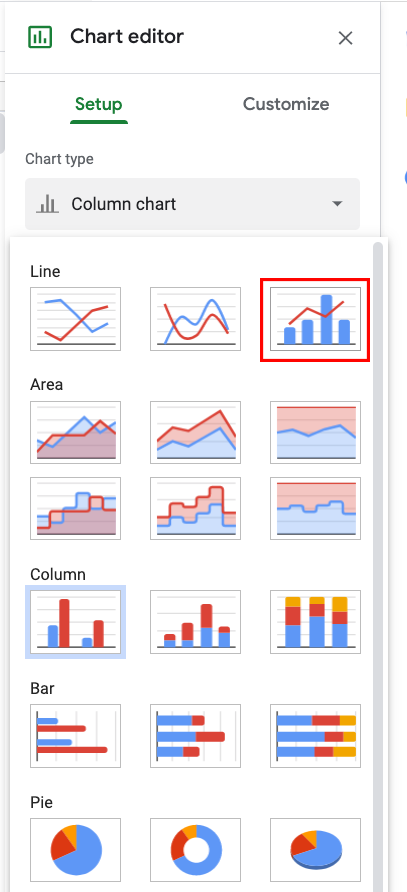
- The Chart menu will open on the right side of the window. In the Chart type drop-down, select the combination chart type.
- Click the X-Axis box to open the Select a data range window. Navigate to the Processed sheet and select the top of the Time tab.
- Click Add Series to open the Select a data range window.
- Repeat the same process to add Series data for the humidity and light columns.
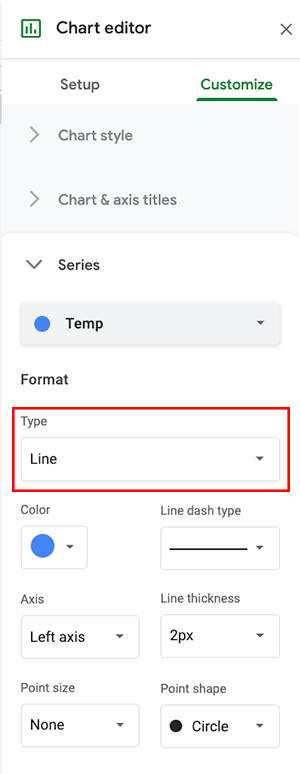
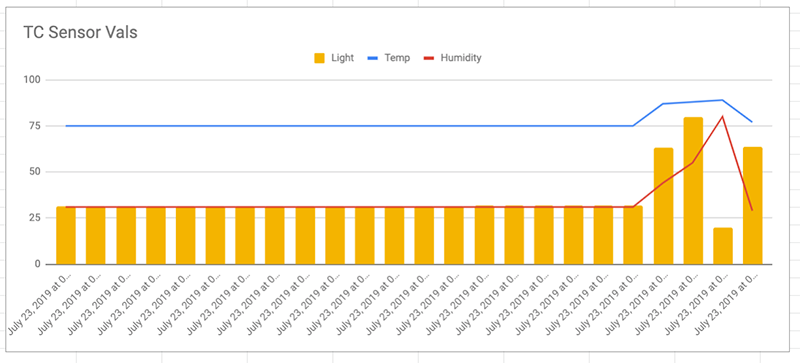
- Now let's customize. In the Chart editor, click the Customize tab and expand the Series item. Select the temp series. Then, change the type to Line.
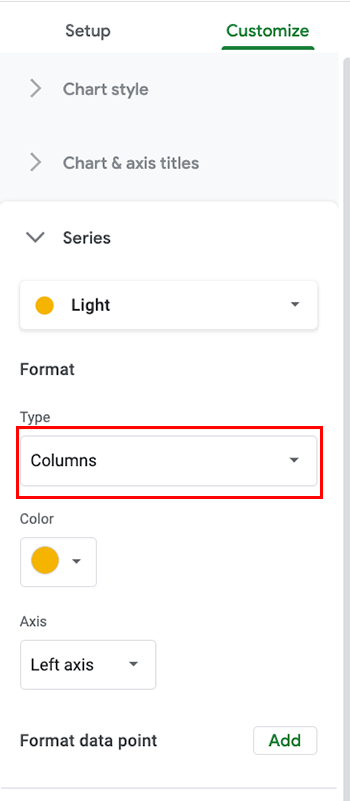
- Now select the light series and change the type to Columns.
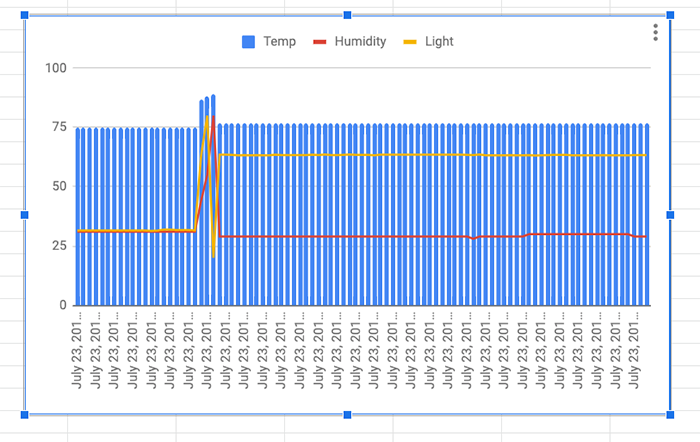
- Close the chart editor. If everything has been configured properly, you'll see a chart that looks like this.
And that's how you do DataViz with Google Sheets and IFTTT. Now performing on-device debugging with Particle Workbench.