
Session 4 - Visualizing sensor data in the cloud
This page is no longer maintained and is provided for historical reference only
| Project Goal | |
|---|---|
| What you’ll learn | Streaming data to Power BI |
| Tools you’ll need | Azure Account, Power BI Account |
| Time needed to complete | 30 minutes |
In this exercise, we're going to send data from IoT Hub to Power BI. When we do that, we'll be able to visualize our temperature data in real-time, as it comes in from the Particle Cloud.
Add a new consumer group to IoT hub
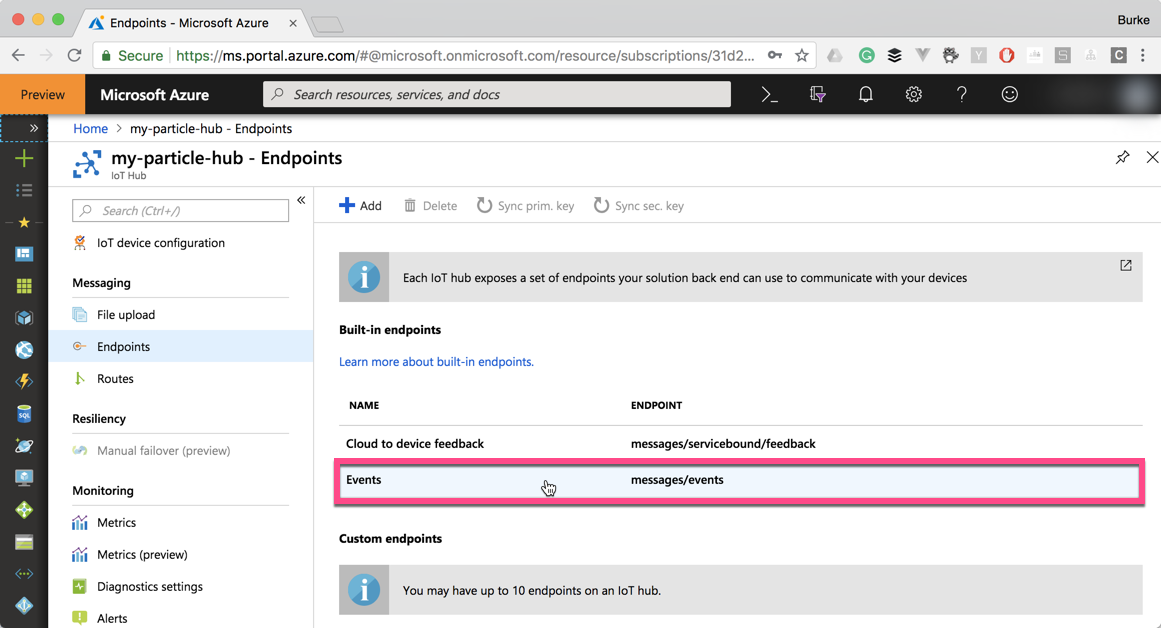
In your IoT Hub, select "Endpoints" under the "Messaging" section and then click on "Events" under Built-in Endpoints.
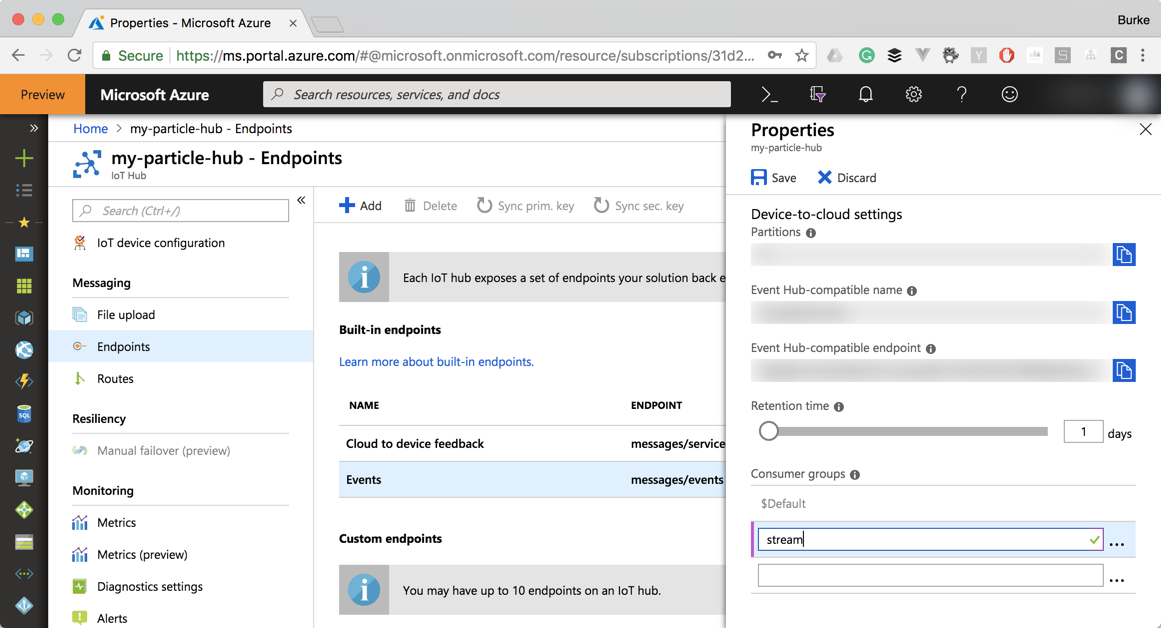
Add a new Consumer Group. Call it "stream". Click the "Save" button at the top.
Setting up stream analytics
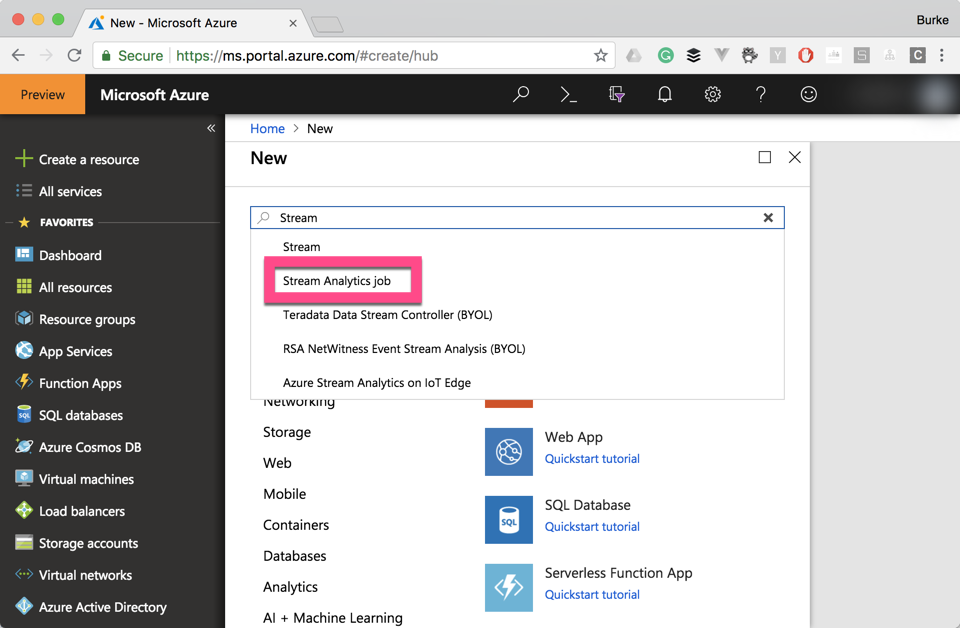
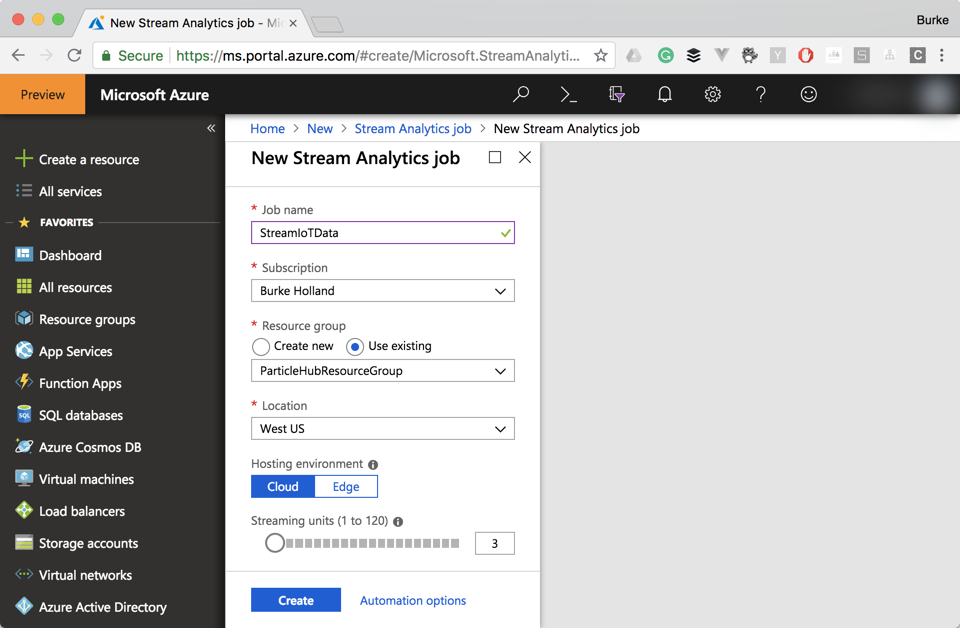
Create a new Stream Analytics Job in the Azure Portal
Give it a name and put it in the same resource group as your IoT Hub. Click "Create".
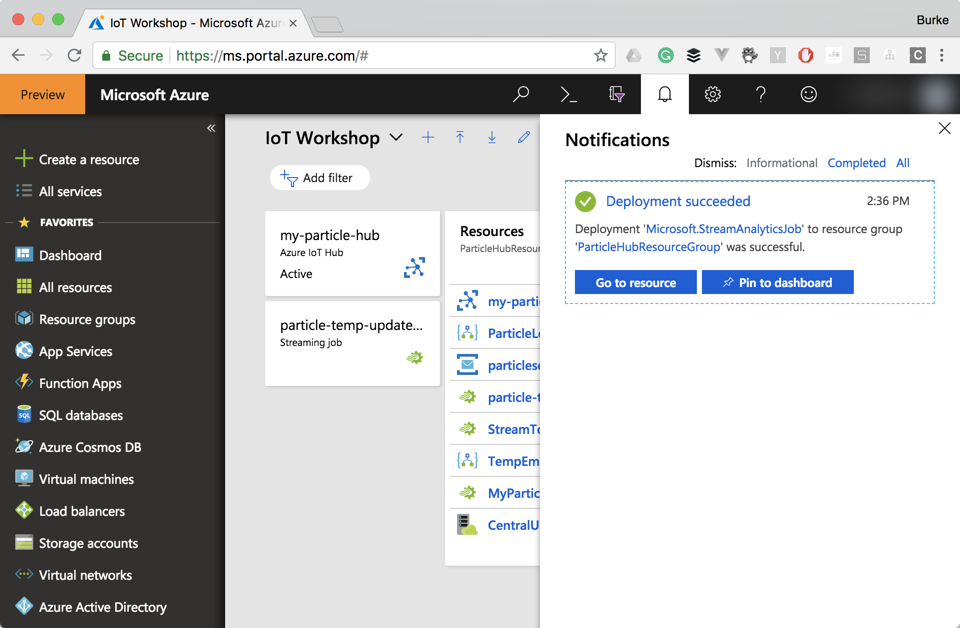
Once the resource is created, you can click on the bell in the right-hand corner to access it. It's also a good idea to pin it to the dashboard at this time.
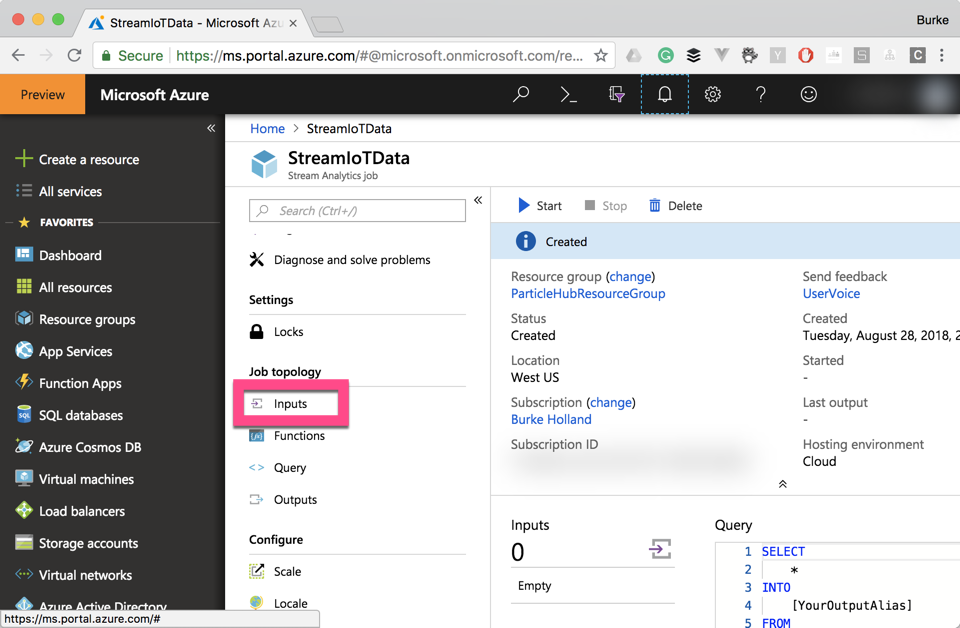
Under the section "Job Topology", select "inputs"
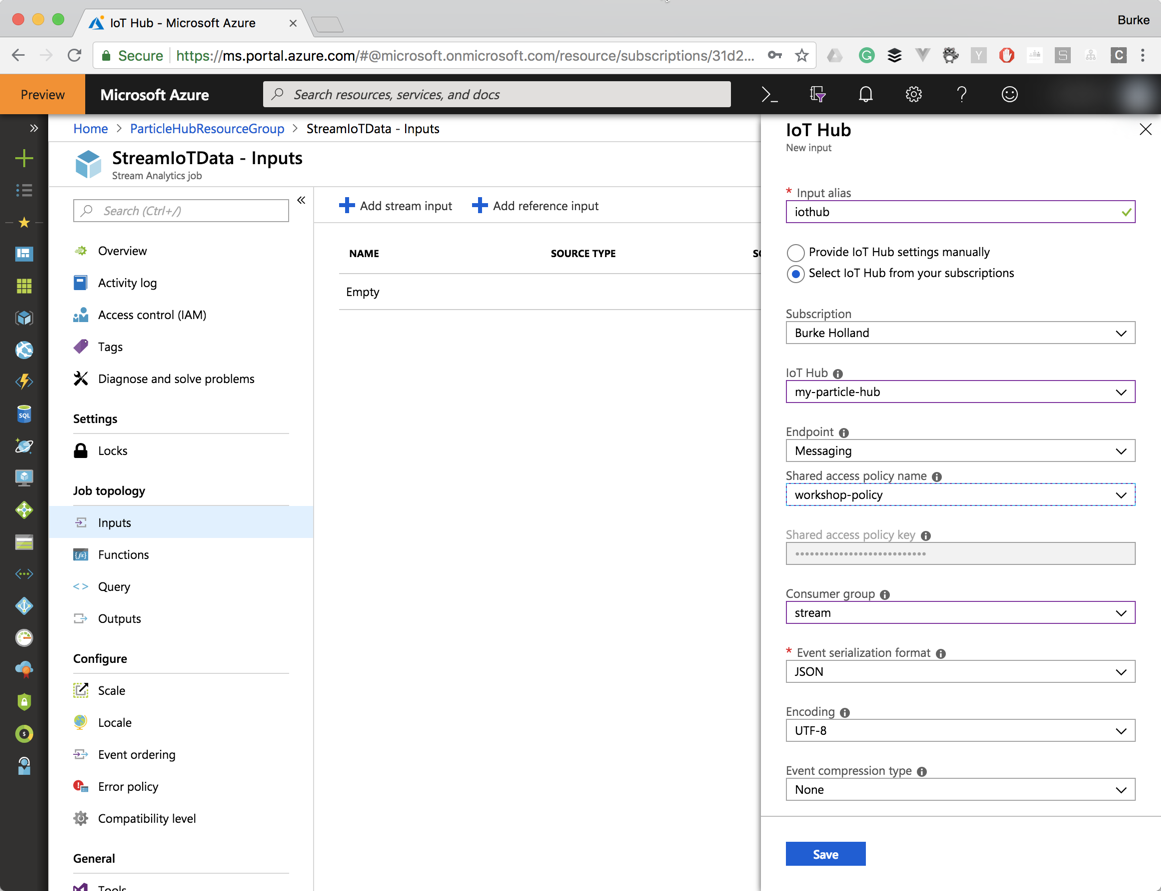
Click on "Add Stream Input" and select "IoT Hub"
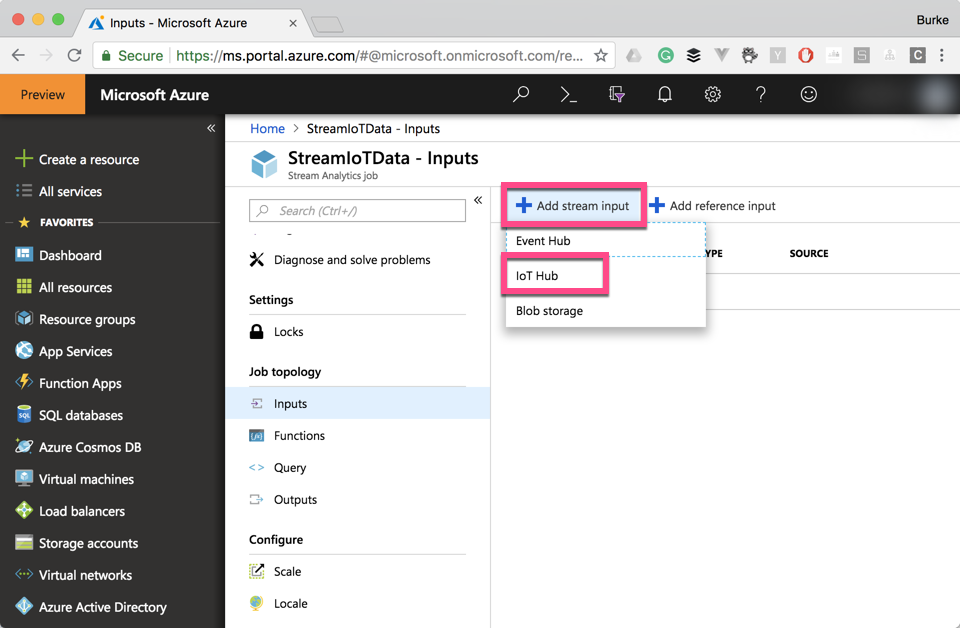
Name it "iothub". Select the correct IoT Hub from your subscription. Change the "Shared access policy name" to the policy you created in Chapter 3. Change the "Consumer Group" to the group you created in the first part of this chapter. Click "Save"
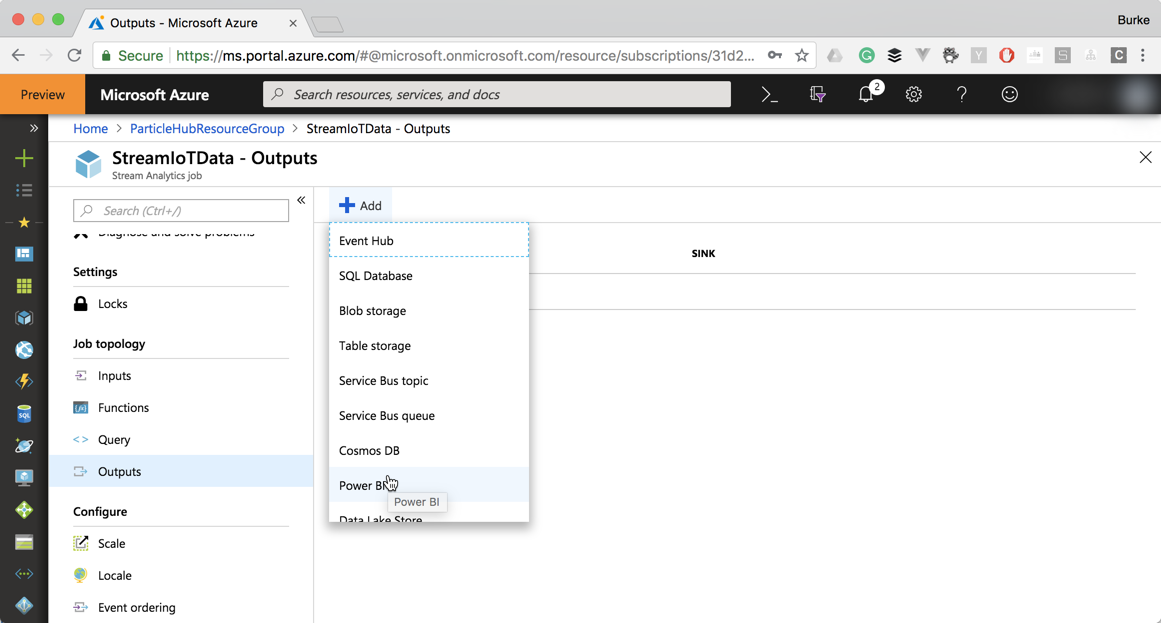
Under the "Job Topology" section, select "Outputs". Click the "Add" button and select "Power BI" from the dropdown list.
Name it "powerbi". You will need to authorize the Azure Portal to Power BI at this point. Once you have done that, you can use the "My Workspace" Group Workspace. Name the Dataset "Photon Data" and the table "Temperature".
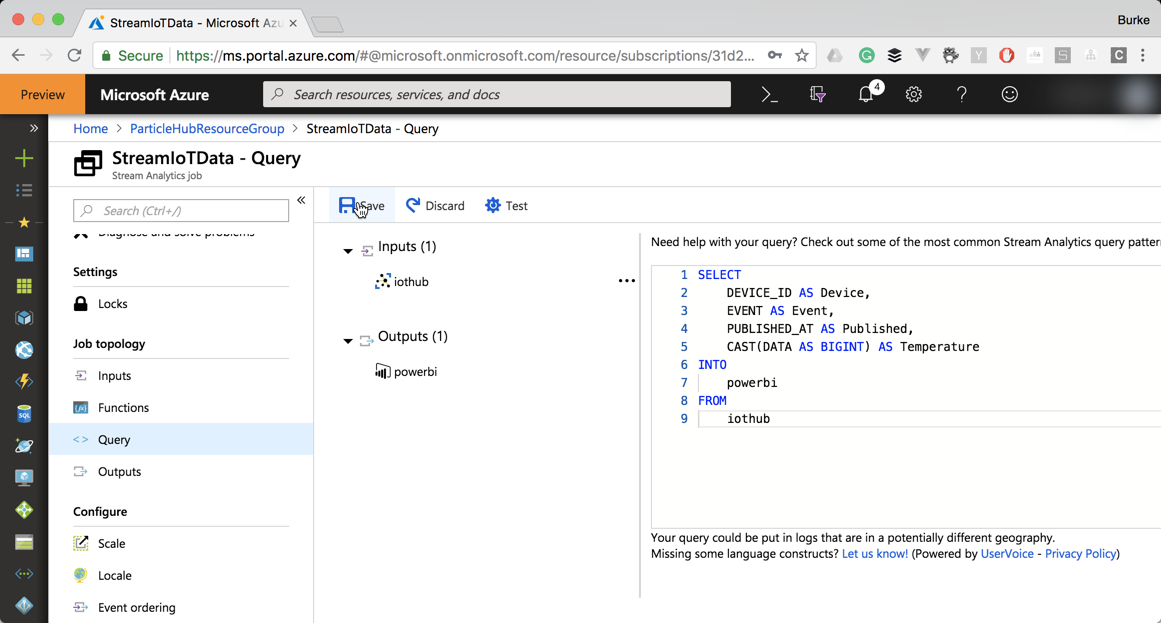
Click on the "Query" option under "Job Topology". Enter the following query...
 SELECT
     DEVICE_ID AS Device,
     EVENT AS Event,
     PUBLISHED_AT AS Published,
     CAST(DATA AS BIGINT) AS Temperature
 INTO
     powerbi
 FROM
     iothub
Don't forget to click "Save".
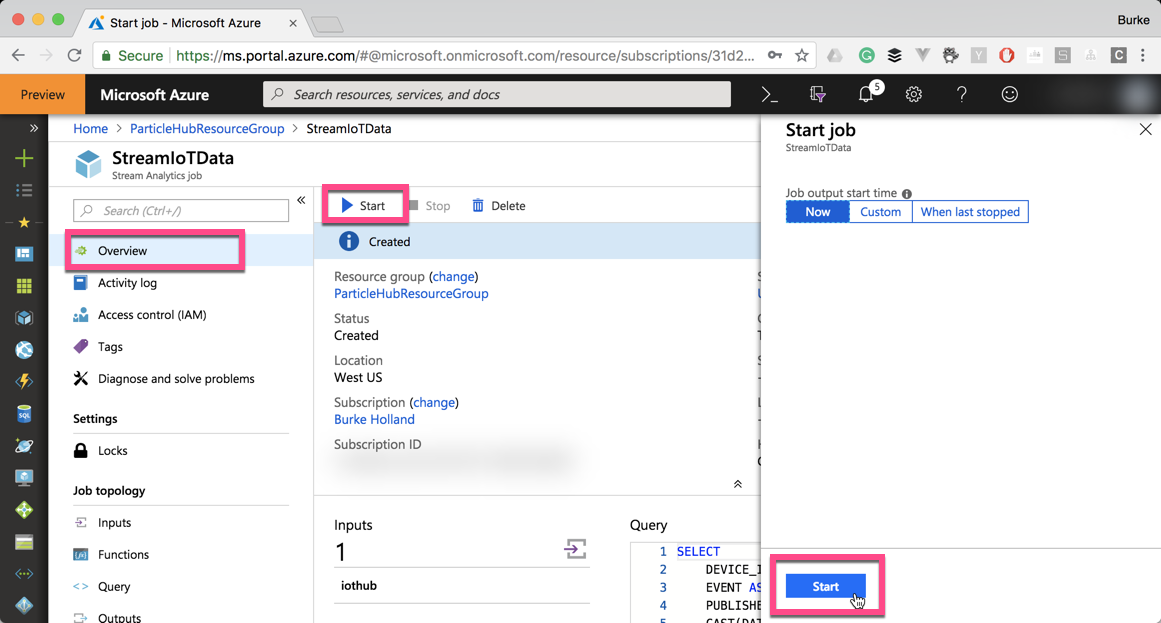
Click on the "Overview" item and click the "Start" button to start the Stream Analytics job.
Create a live streaming power BI dashboard
Log in to Power BI at powerbi.microsoft.com
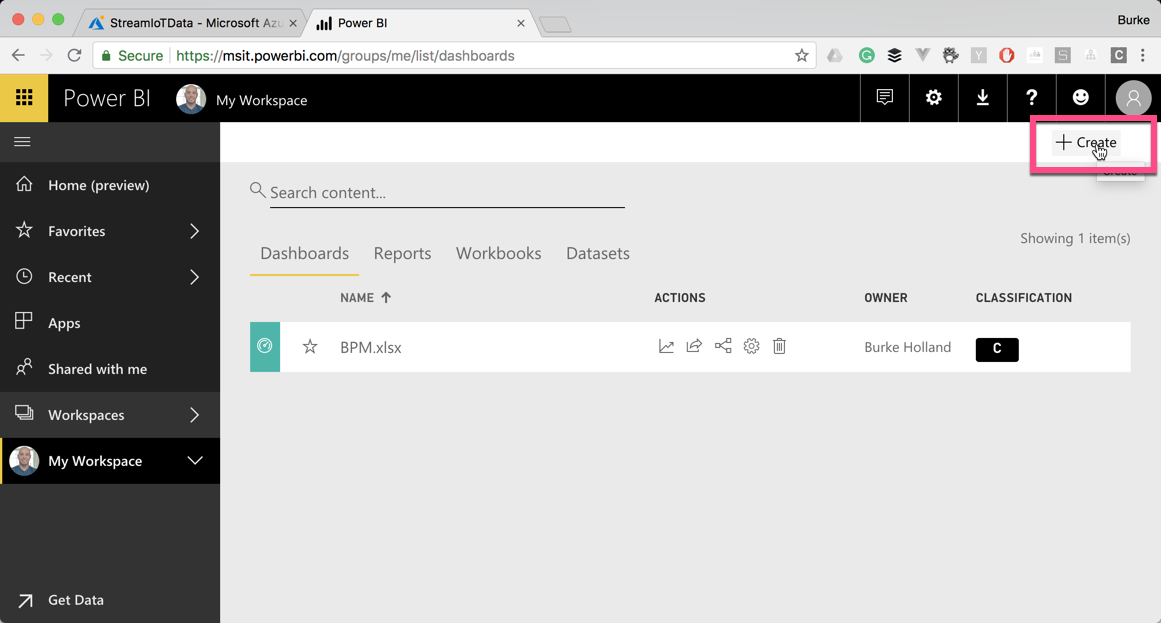
Click on the "My Workspace" section in the sidebar. Click the + button in the corner to create a new dashboard.
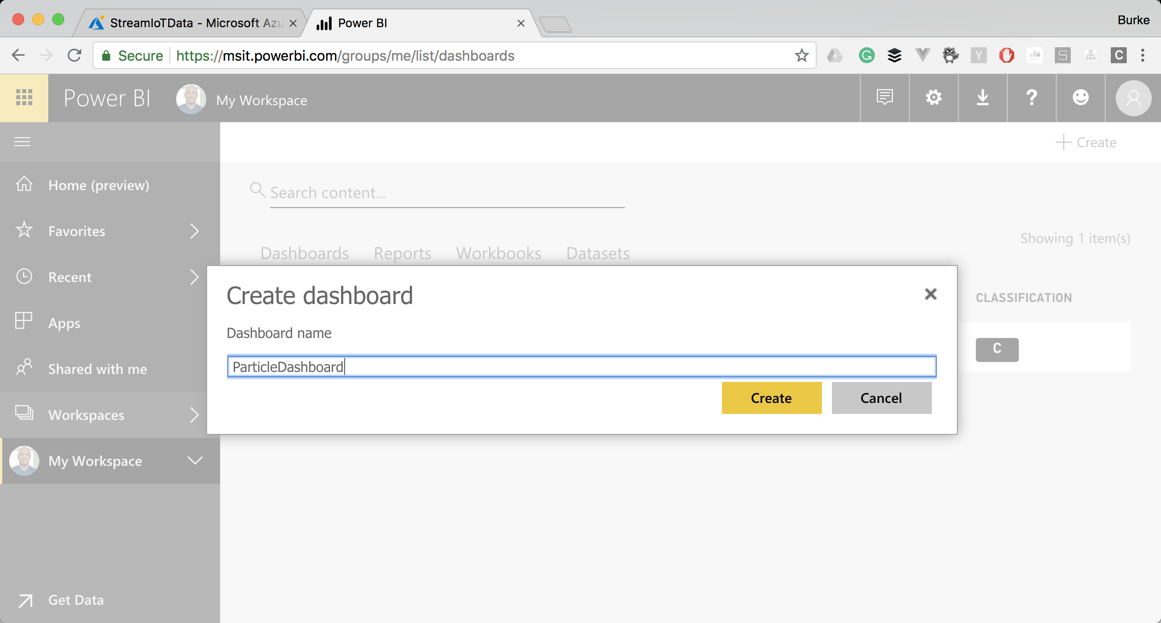
Name the dashboard "Particle Dashboard"
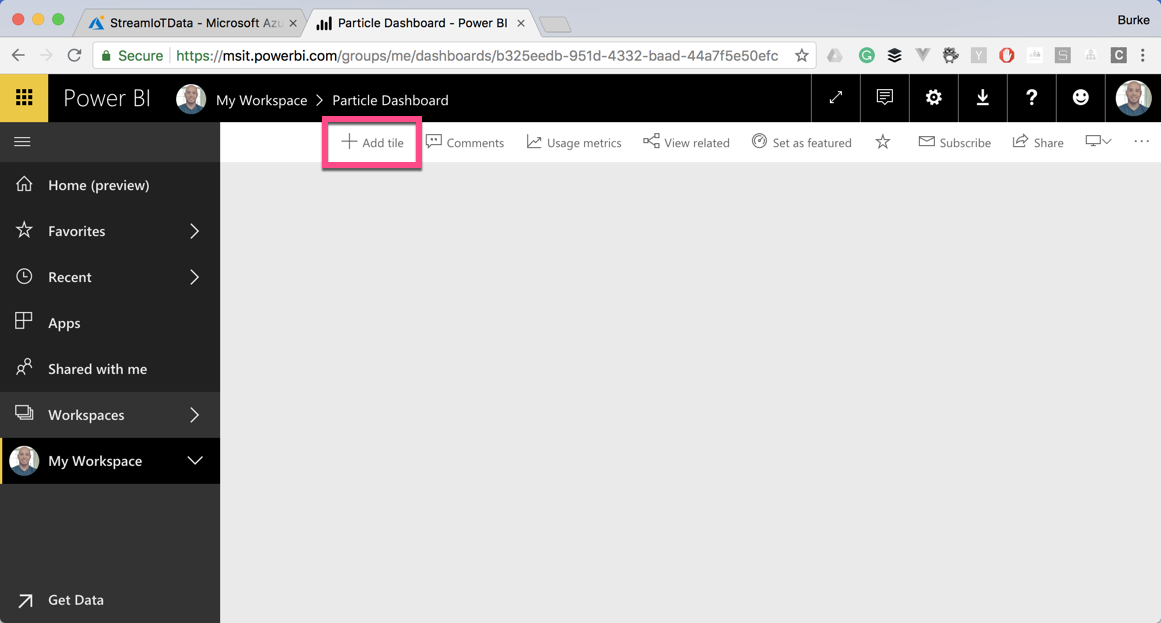
Click the "Add Tile" button
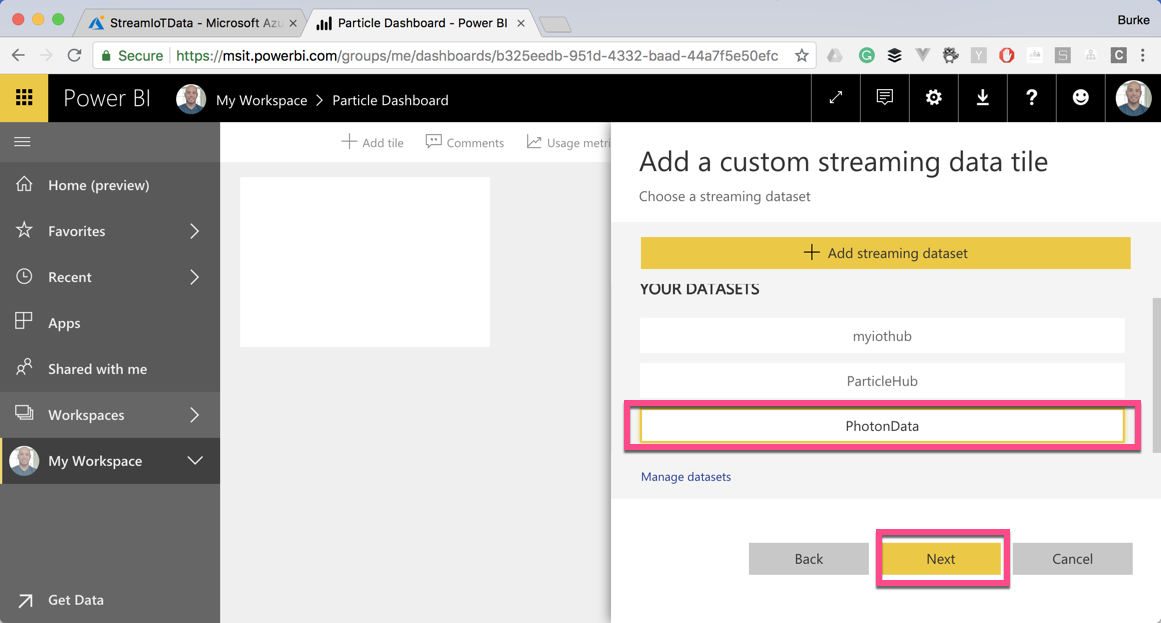
Scroll down on the right-hand side and select "Custom Streaming Data". Then select "Photon Data". Click "Next".
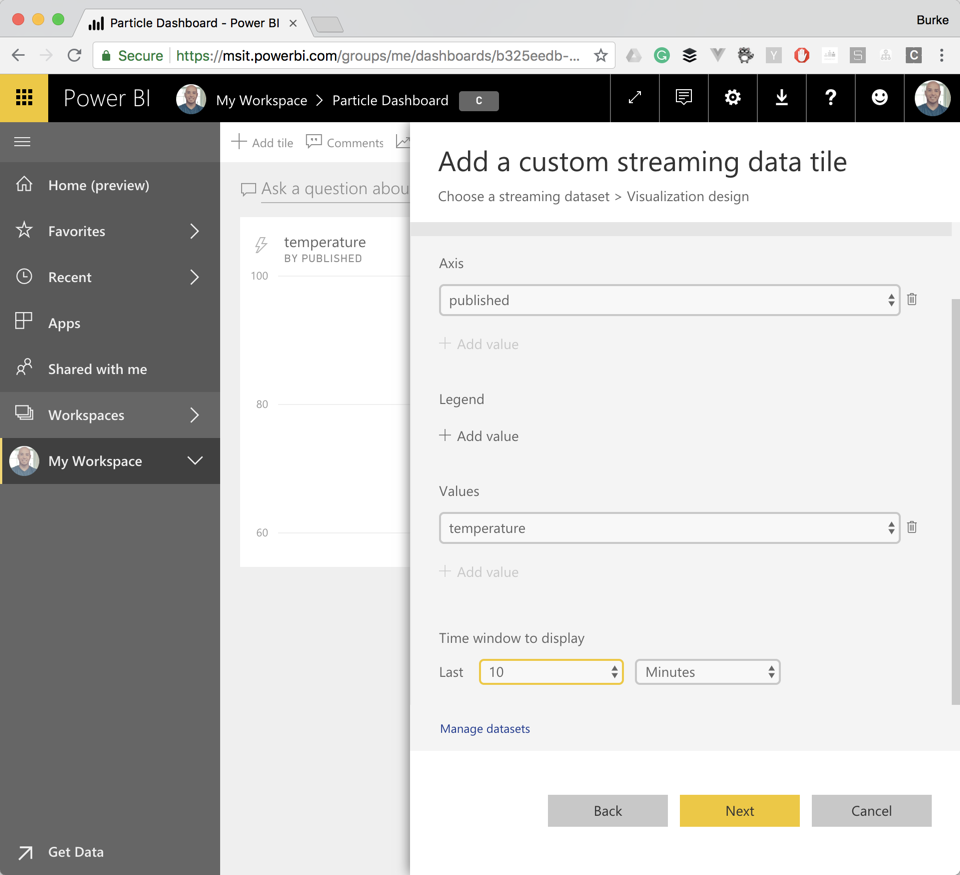
Select the "Line chart" visualization type. For the "Axis", click "Add value" and select "published". Scroll down a little further to the next "Value" field and select "Temperature". Then click "Next".
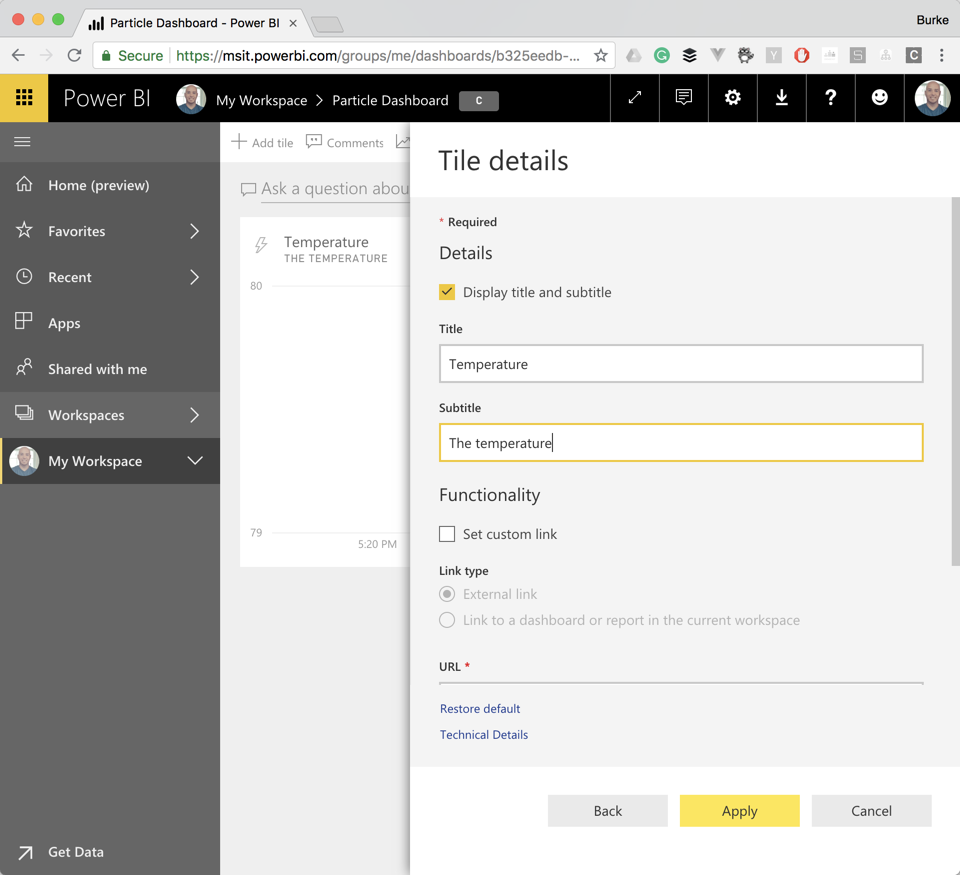
Add any tile details you like and click "Apply"
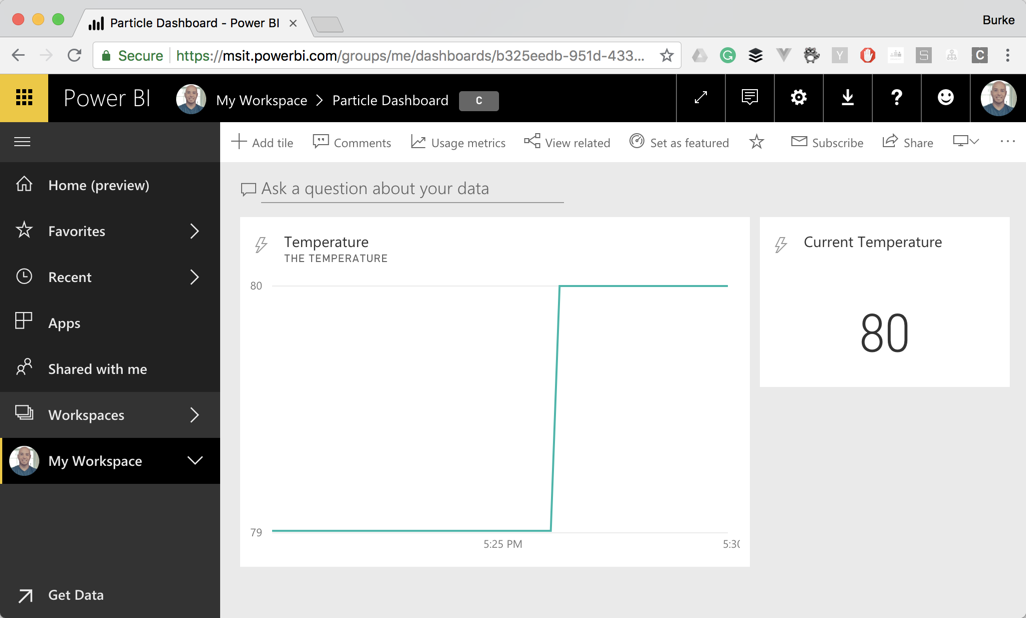
You should now have a line chart that will update every 10 seconds with the current temperature of your thermometer. It's still a bit hard to know exactly what the current temperature is. See if you can add another tile on your own which pulls from the streaming data set and just shows the current temperature.