
InfluxData Integration
Particle has teamed up with InfluxData to create an easy webhook integration with the InfluxData Platform. The InfluxData Time Series Data platform is a purpose-built platform for the highly efficient collection, storage, querying, analysis and alerting of IoT data.

Send device data from Particle into InfluxData Platform with ease
Streaming data from Particle devices into InfluxData via a webhook is now fully supported via a plugin to the Telegraf component of InfluxData's TICK stack. With a simple configuration of a webhook, and an existing -- or new -- instance of Telegraf and InfluxDB you can stream large amounts of data from your Particle devices via the Particle Device Cloud.
- Store data from a fleet of devices in a high-performance, time series database
- Combine data sources from an entire fleet into unified data flows that provide product-wide dashboards, analysis, and alerting functions
- Take action in the physical world based on results of predictive analysis of real-time data and historical data that can trigger actions on devices or through other web services.
Note:
Changes made on the InfluxData service since this integration guide was created have caused some steps and screens to vary from the guide below, but the technique still works.
Setting up InfluxData services
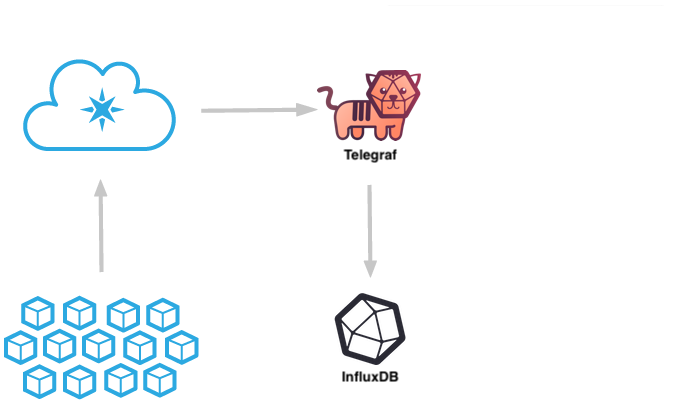
Data is routed from your Particle devices through the Particle Cloud and into the InfluxData Platform via the Telegraf Data Collection Agent.
Device data gets routed through the Particle Device Cloud and then to a running instance of InfluxData's Telegraf data collection service. Telegraf then routes that data to your instance of InfluxDB where you can create real-time dashboards using Chronograf, perform data analysis and alerting using Kapacitor, and store your sensor data for long-term data analysis.
The Particle cloud will publish device data to an InfluxDB database and measurement. The database used is defined in the Telegraf configuration file and the measurement is defined in your Particle Webhook configuration.
Before setting up the integration in Particle, there are a few pre-configuration steps that you must do. These instructions are also included in the Particle Console when you enable the InfluxData Platform integration.
Deploy a Telegraf agent
If you don't already have one, you'll need to have a running Telegraf Collection Agent. You can follow the Getting Started Document for setting up your own hosted Telegraf instance on any server or cloud platform you choose.
Deploy an InfluxDB instance
If you don't already have an InfluxDB server running you can easily start one on your existing server by following the Getting Started Guide for your server architecture.
Using InfluxCloud
If you'd like a fully managed instance of Influx Enterprise you can start a free trial on InfluxCloud by going to InfluxCloud and clicking the "Start Free Trial" button.
InfluxCloud is a secure, fully managed SaaS offering with all the features of the InfluxData platform. InfluxCloud includes a hardened version of the open source core (TICK stack), clustering for high availability and scalability, Grafana for advanced visualization, automatic backup and restore functionality, and 24x7 infrastructure monitoring.
Note: InfluxCloud does not include an instance of Telegraf so if you are using InfluxCloud you will need to spin up an AWS, DigitalOcean or other server to host your Telegraf agent.
Using Amazon AWS
If you're looking for an easy way to get yourself a fully-provisioned Open-Source version of the entire TICK stack you can try spinning up an Amazon EC2 pre-configured image. InfluxData has provided an AMI that you can simply launch in your own account. This instance has InfluxDB, Telegraf, Chronograf and Kapacitor already installed -- and the Telegraf config file already edited to enable the Particle Plugin -- to make it easy to start testing your application. Just sign in to your AWS account, Click on "AMIs", then search the Public AMIs for "InfluxDB-IOT." There are restrictions in AWS about how AMIs can be shared, and currently this AMI is only available in the "US-East N. Virginia" region, so you may have to change your region in order to find it.
Once you've set-up an instance of this AMI in your local account, follow the provided instructions for logging into your instance via ssh and run the following commands to make sure the image is up-to-date:
$ sudo apt-get update
$ sudo apt-get upgrade
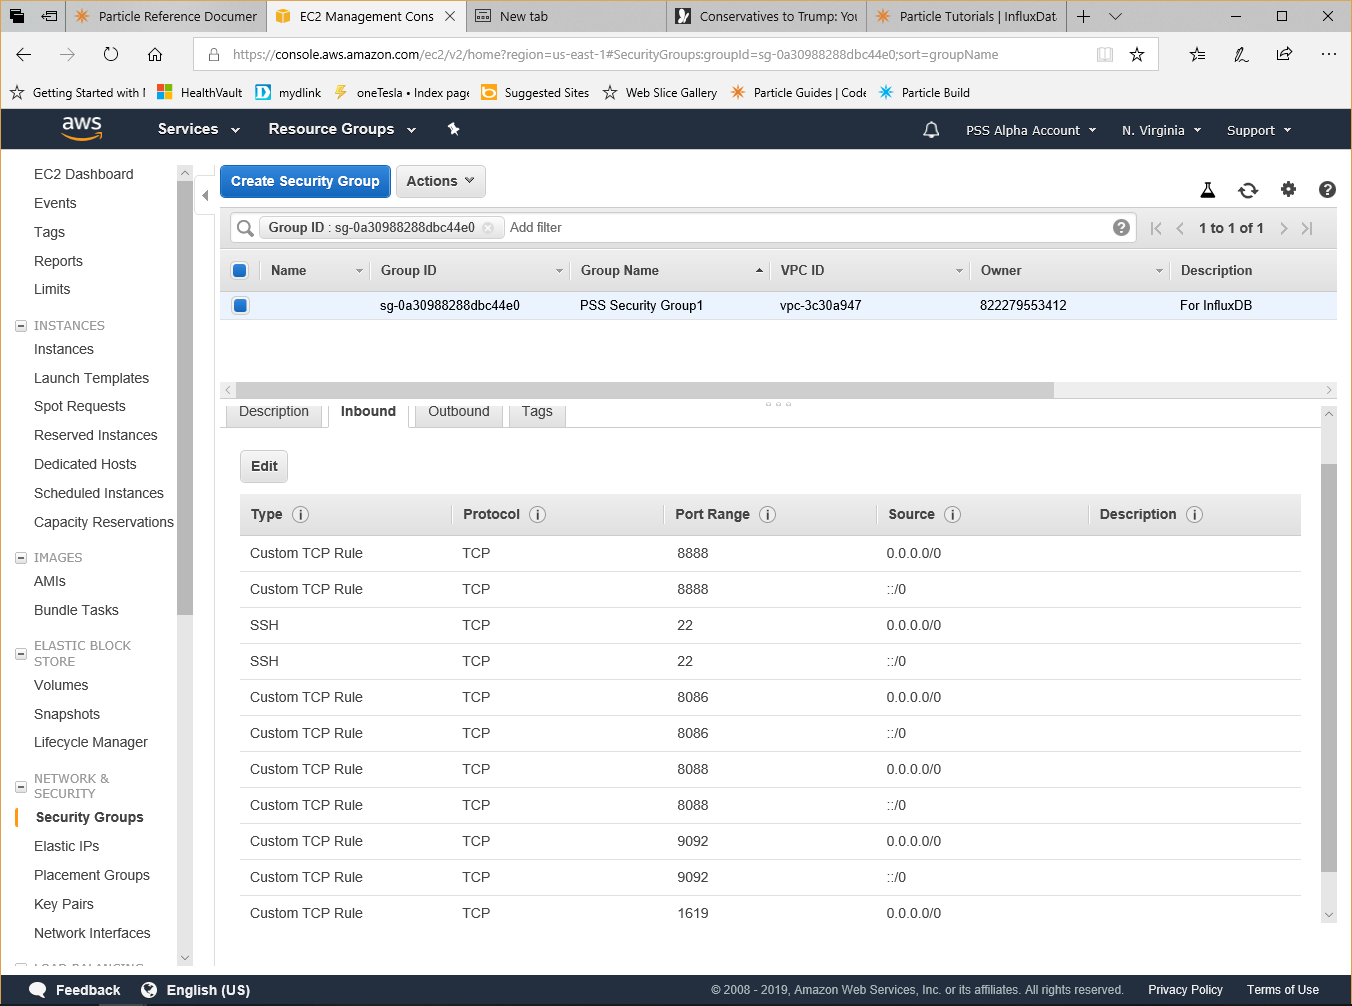
Configure AWS security settings
Add the necessary networking settings as a new Security Profile that you can then apply your InfluxDB AMI.
Configuring Telegraf
Edit the telegraf.conf file
You'll need to login to the server where you are running Telegraf and make sure that the Particle Plugin is enabled.
$ sudo nano /etc/telegraf/telegraf.conf
Then simply remove the comments hash (#) before the 2 lines containing 'Particle', the [[inputs.webhooks]] line, as well as the service_address = ":1619" line.
## A Webhooks Event collector
[[inputs.webhooks]]
#
## Address and port to host Webhook listener on
service_address = ":1619"
#
#   [inputs.webhooks.filestack]
#     path = "/filestack"
#
#   [inputs.webhooks.github]
#     path = "/github"
#     # secret = ""
#
#   [inputs.webhooks.mandrill]
#     path = "/mandrill"
#
#   [inputs.webhooks.rollbar]
#     path = "/rollbar"
#
#   [inputs.webhooks.papertrail]
#     path = "/papertrail"
[inputs.webhooks.particle]
  path = "/particle"
Then restart Telegraf
$ sudo systemctl restart telegraf
To check to make sure that the service is listening on port 1619, run the following command:
$ netstat -nlp
You should see an output similar to the following:
Active Internet connections (only servers)
Proto    Recv-Q    Send-Q    Local Address     Foreign Address    State     PID/Program name
tcp      0            0       0.0.0.0:22        0.0.0.0:*          LISTEN -
tcp      0            0       127.0.0.1:8088    0.0.0.0:*          LISTEN -
tcp6    0          0       :::1619            :::*               LISTEN -
tcp6    0         0       :::22              :::*              LISTEN -
tcp6    0          0       :::8086           :::*               LISTEN -
tcp6    0          0       ::::8888           :::*              LISTEN -
tcp6    0          0       ::::9092           :::*               LISTEN -
You’ll notice that the system is listening on port 1619 — so Particle Webhooks can communicate with it, on 8888 which enables Chronograf, as well as 9092 (for Kapacitor) and 8086 and 8088 for InfluxDB.
Enabling the integration
Particle Console
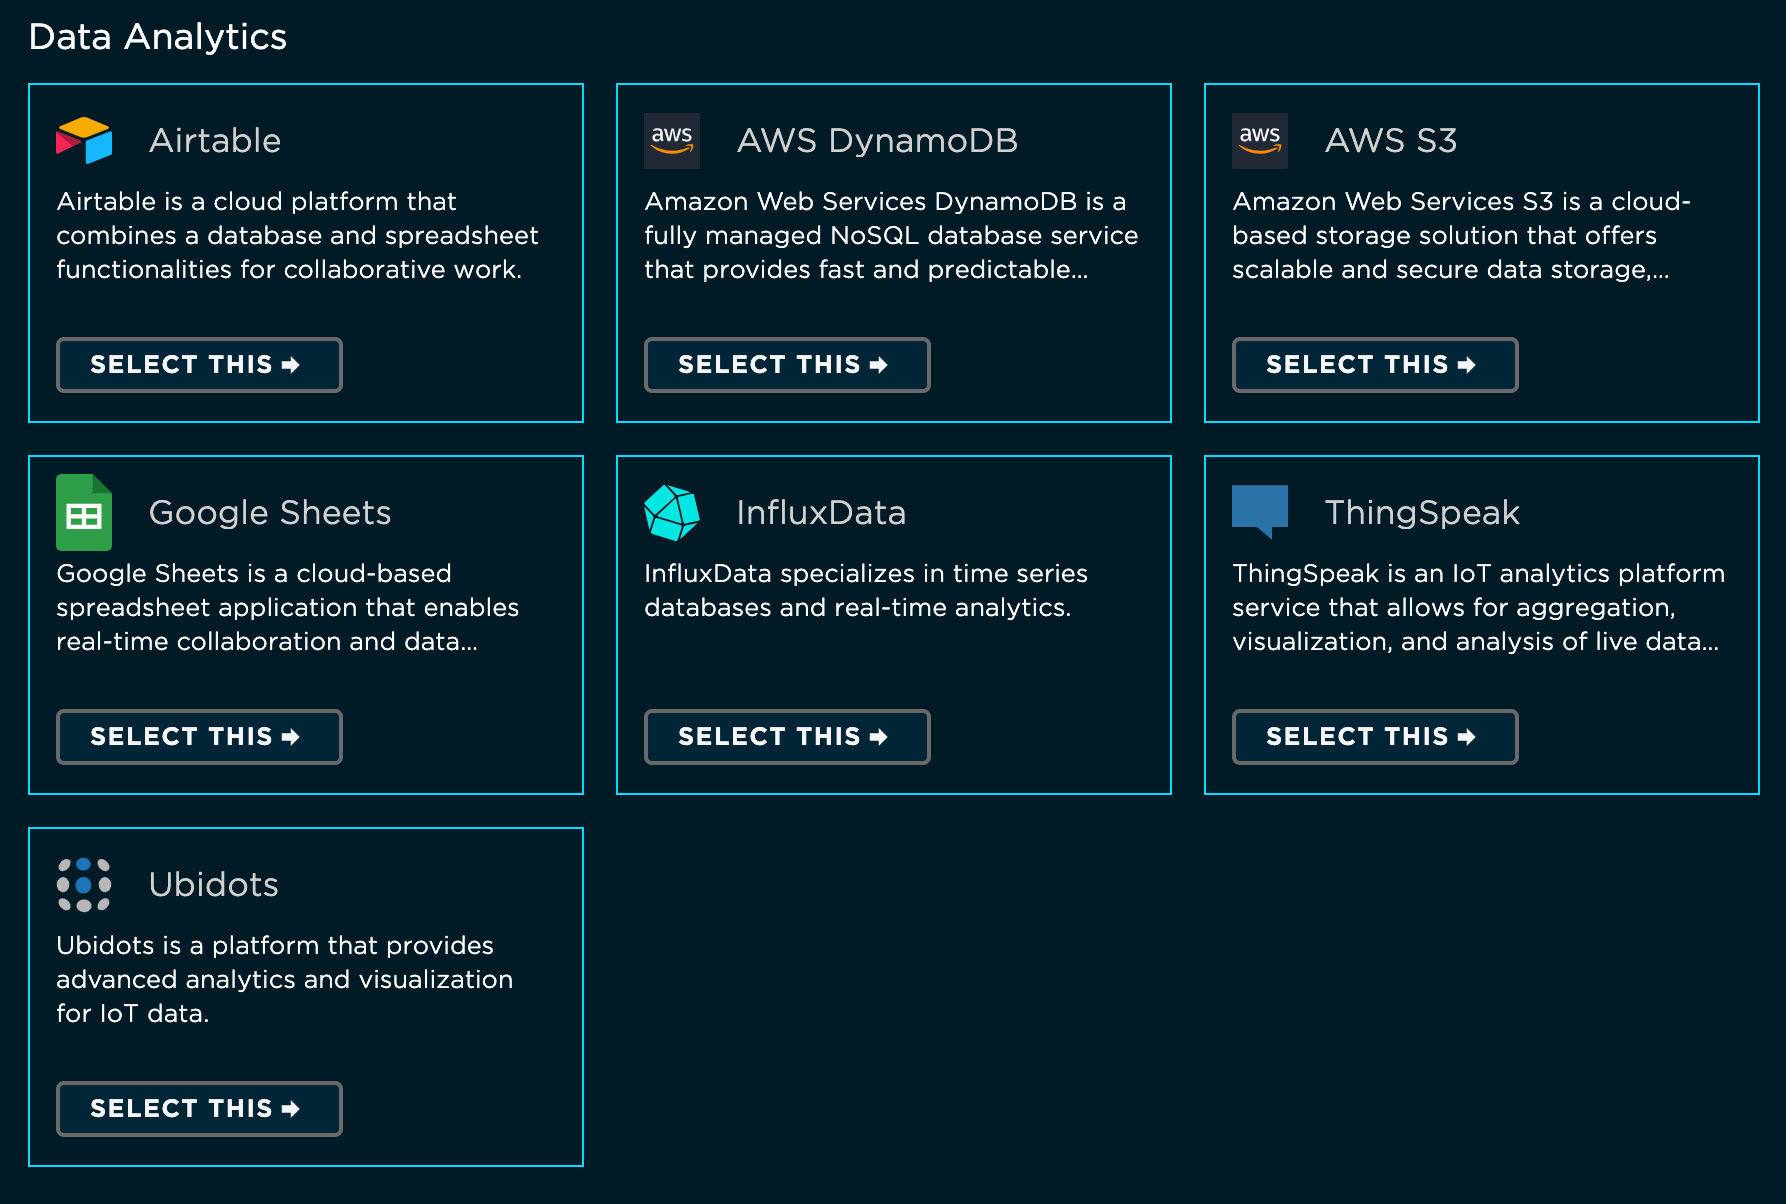
Start by going to the integrations by clicking on the integrations icon in the sidebar in the Particle console in your developer sandbox or in a product.
If you already have integrations configured, click the New Integration button to open the integration gallery. If this is your first integration, you will open to the integration gallery automatically. Select InfluxData.
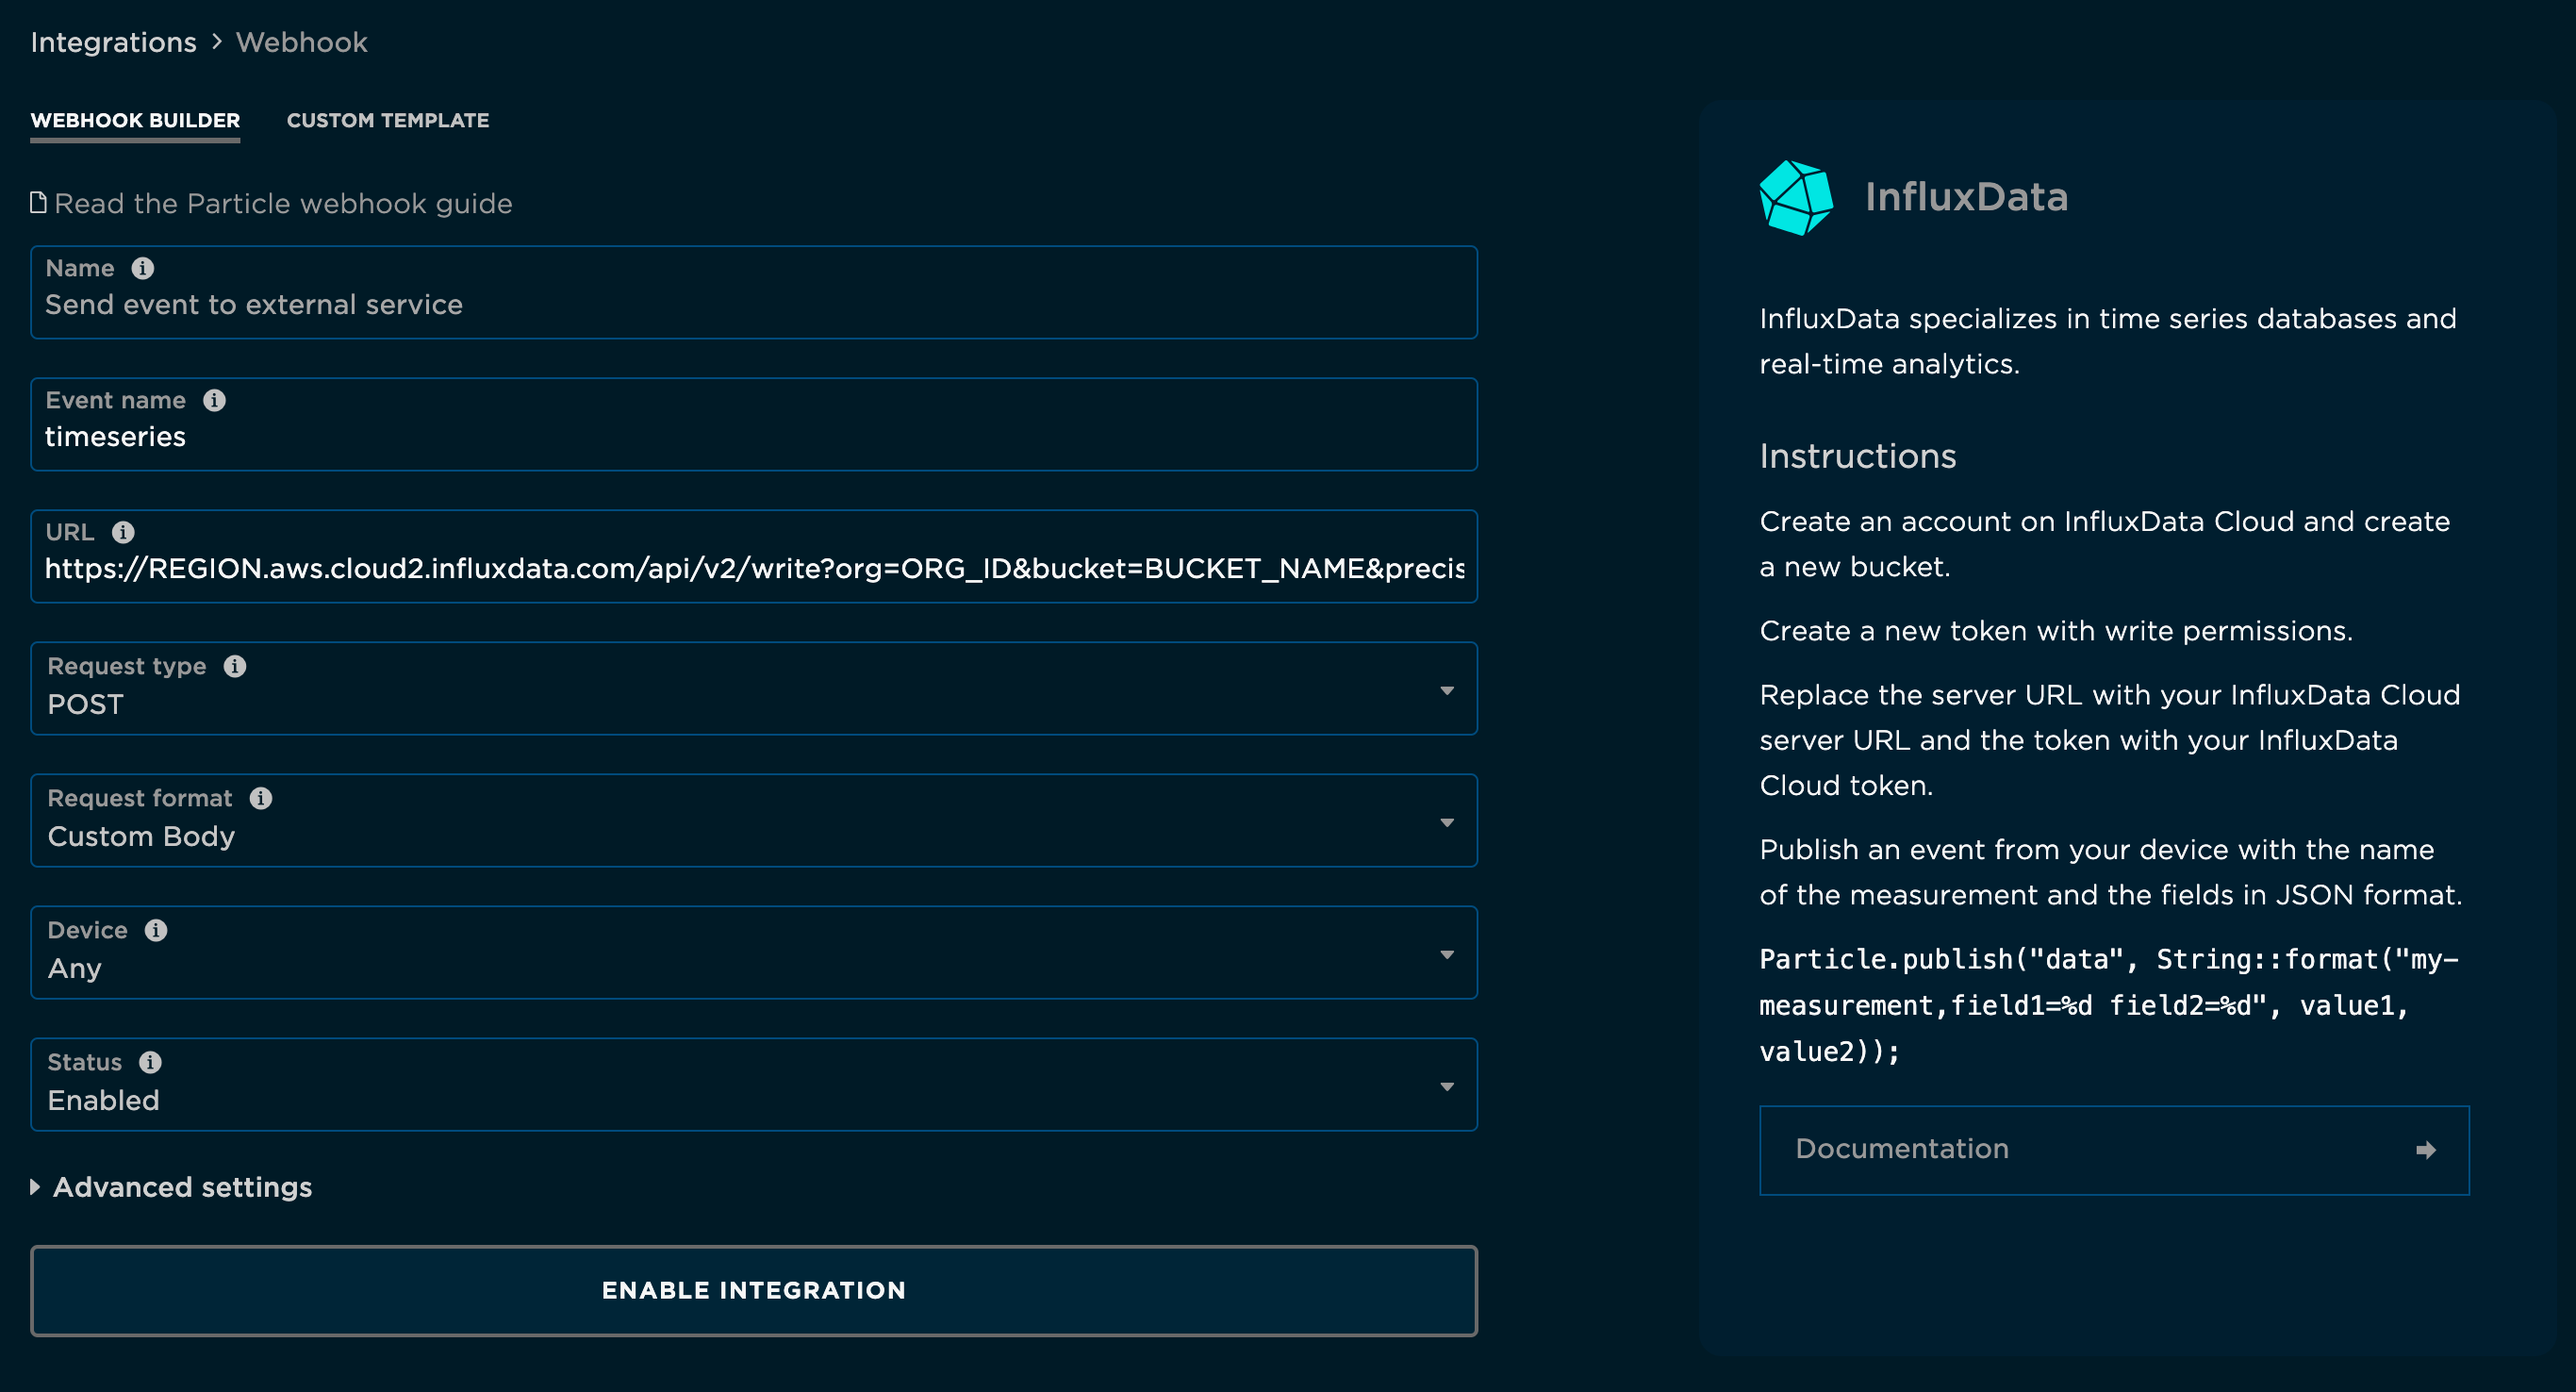
The next step is configuring the Webhook. Fill out the following fields:
- Event Name: The name of the event that will trigger publishing an event InfluxDB. This is the name of your event when you call
Particle.publish()in your firmware. - URL: The url or IP address of your Telegraf server in AWS. Don't forget the
:1619/particleportion of the URL! - Request Type: The Telegraf server is expecting a
POSTso make sure that's selected. - Request Format: Set this to
JSON.
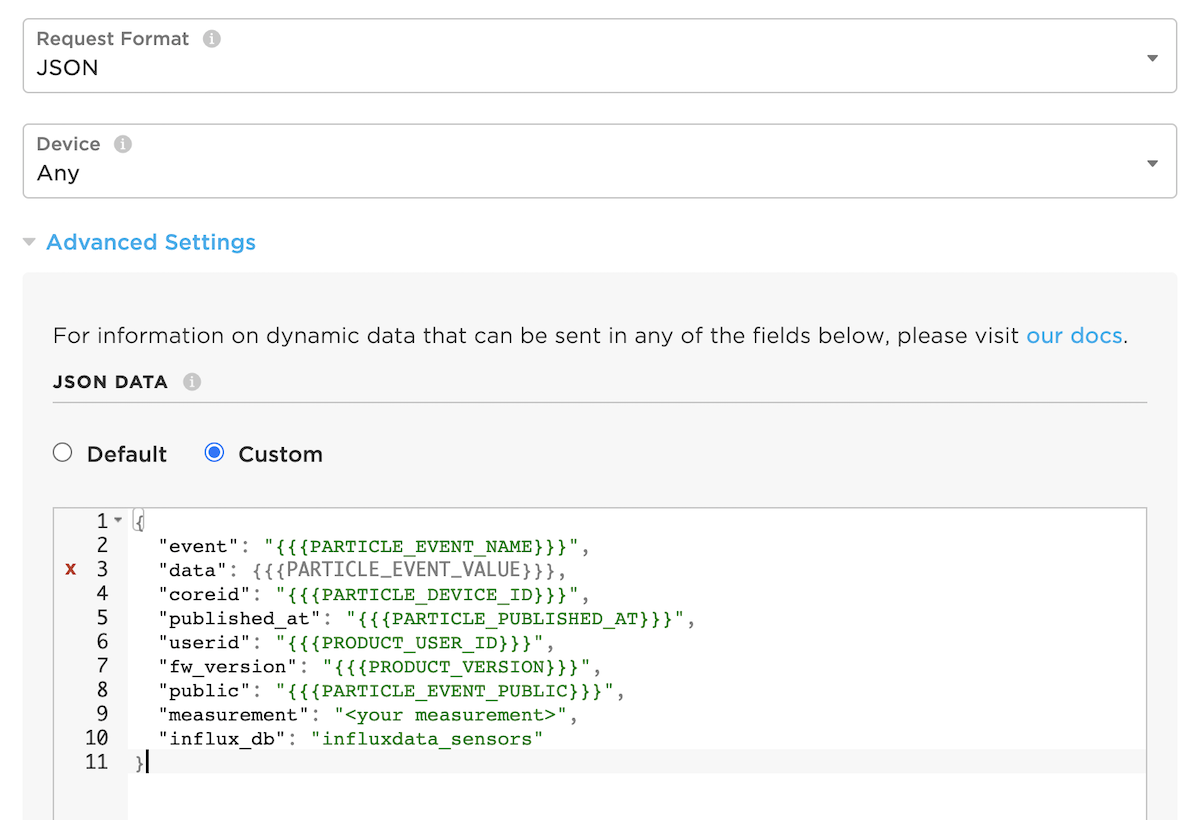
You'll need to click the Advanced Settings area to fill out the custom JSON format. You can fill this out as follows:
{
  "event": "{{{PARTICLE_EVENT_NAME}}}",
  "data": {{{PARTICLE_EVENT_VALUE}}},
  "coreid": "{{{PARTICLE_DEVICE_ID}}}",
  "published_at": "{{{PARTICLE_PUBLISHED_AT}}}",
  "userid": "{{{PRODUCT_USER_ID}}}",
  "fw_version": "{{{PRODUCT_VERSION}}}",
  "public": "{{{PARTICLE_EVENT_PUBLIC}}}",
  "measurement": "<your measurement>",
  "influx_db": "influxdata_sensors"
}
Note the entry for “data” is flagged as an error by the Particle Webhook edit screen as it is missing quotation marks around PARTICLE_EVENT_VALUE. However, the current setup of Telegraf only works this way and the Particle Cloud integration will still accept the advanced settings.
Click "Create Webhook." You have now successfully told the Particle cloud to stream data to InfluxDB via Telegraf!
It's time to move on to your Firmware!
Firmware
Now that the integration is enabled in the Particle cloud, the final step required to get data streaming into InfluxDB is to flash a device with some firmware that publishes the targeted event. Head over to the Particle Web IDE, Local IDE, or whichever IDE you are using for firmware development.
If you're already working on a firmware application, just make sure you include a Particle.publish() with the event name matching the event used to enable the
Google Cloud Platform integration above. Otherwise, if you need some sample firmware, paste in the below code into your firmware app:
// The on-board LED
int led = D7;

void setup() {
  pinMode(led, OUTPUT);
}
void loop() {
  // Turn the LED Off
  digitalWrite(led, HIGH);
  // Publish an event to trigger the integration
  // Replace "my-event" with the event name you used when configuring the integration
  // You'll also create a valid JSON object to send to the Particle
  // Device Cloud
  // The JSON is formatted:
  // { "tags: {
  //            "tag1": "value,
  //           "tag2": "value:
  //      },
  //      "values": {
  //          "sensor_value1": 100,
  //          "sensor_value2": 55.65
  //      }
  //  }

  String data = String::format("{ \"tags\" : {\"id\": \"%s\", \"location\": \"%s\"},\"values\": {\"temp\": %f, \"temp_f\": %f}}", myID.c_str(), myName.c_str(), temperature, fTemp);
  Particle.publish("my-event", data, PRIVATE);
  // Wait for 3 seconds
  delay(3000);
  // Turn the LED off
  digitalWrite(led, LOW);
  delay(3000);
}
The above code will publish an event every 6 seconds, when the on-board LED turns on containing the tags 'id' and 'location' and the values 'temp' and 'temp_f' which you could have read from a sensor. Your JSON can contain as many tags and fields (values) as you wish.
Go ahead and flash the firmware with the Particle.publish() that will trigger the integration to
a Particle device.
Once confident in the firmware, you can stream data from large numbers of devices by rolling out the firmware to a product fleet. Remember that this requires creating the integration under the product scope, allowing any device in the product fleet to trigger the it.
Congrats! This is all you need to get the integration working end-to-end. Your device will now begin to publish the targeted event, which will signal to the Particle cloud to stream the contents of the event to your InfluxDB instance.
Confirming the data reaches InfluxDB instance
To ensure that the data is successfully being published to InfluxDB, you can use Chronograf, the visual graphing front-end to InfluxDB. Simply point your browser at your Chronograf instance (typically the same address as your InfluxDB instance, on port 8888) and browse the Data:
Example use cases
We are in need of more example use cases for this integration. Please help us improve this tutorial by contributing to this page. We will shower you with kudos and smiley emojis and if you tell us about it, InfluxData Swag!
Storing data in an InfluxData database
One relatively universal application of the Particle & InfluxData Platform integration is the ability to store device data into a long-term database. InfluxDB offers the ability to set data retention policies on your IoT Sensor data, as well as create visual dashboards and apply complex rules for data analysis and alerting from within the platform. Please read the documentation at InfluxData for more details on the other aspects of the platform.