
USB serial debugging
While Particle Devices typically communicate using the Particle Cloud and the Internet, for debugging code and troubleshooting, it's often common to use a USB connection to your computer or laptop. It's also possible to update your user firmware and Device OS over USB.
It's not possible for devices to communicate with the Internet over USB; they must use the network type they are designed for, such as Wi-Fi or cellular.
Particle devices are a USB device, intended to connect to a computer. They cannot be used as a USB host, so you cannot plug a USB keyboard into a Photon or Argon, for example. You also cannot connect something like a USB RS232 adapter, though they are other, easier ways to add serial ports.
You generally cannot connect your phone to a Particle device by USB. The normal method of communicating with a mobile app is over the Internet through the Particle cloud. Gen 3 Particle devices can connect by Bluetooth LE (BLE) to your phone. Gen 2 Wi-Fi devices (Photon, P1) have a limited ability to communicate directly over Wi-Fi for device setup.
Some Android phones can plug directly into a Particle device by USB by using a USB OTG ("on the go") adapter, which allows your phone to behave mostly like a USB host, even though it's normally a USB device. Apple iOS (iPhone and iPad) devices do not support USB OTG.
Using a terminal program
Particle CLI
A common way to view debug serial messages is the Particle CLI. Note that the CLI only reads serial messages, it is strictly a serial monitor, and you can't type things to the Photon/Electron. Still, it's quick and easy, and very handy.
$ particle serial monitor
Opening serial monitor for com port: "/dev/cu.usbmodemFD1161"
On Windows, open a Command Prompt window to use the particle serial monitor command. For Mac or Linux, open a Terminal window.
One particularly useful command line option is the --follow option which will reconnect to the Particle
device if it disconnects. This is helpful because if the device resets (including after a firmware update)
USB serial is briefly disconnected. To stop reconnecting, press Ctrl-C.
particle serial monitor --follow
The Windows Command Prompt has an unusual method of copying to the clipboard:
- Press Ctrl-M ("mark"). It's also available if you click on the icon in the upper left corner of the window in the Edit menu.
- Drag a selection around the text you want to copy.
- Press Enter to Copy to the clipboard (also in the Edit menu).
If your device is not found using the serial monitor on Windows 10, see Troubleshooting Windows 10 device drivers.
Particle Workbench
In Particle Workbench (VS Code), open the command palette (Command-Shift-P on the Mac, Ctrl-Shift-P on Windows and Linux) and select Particle: Serial Monitor.
Windows
For Windows, you can also use a program like PuTTY or CoolTerm.
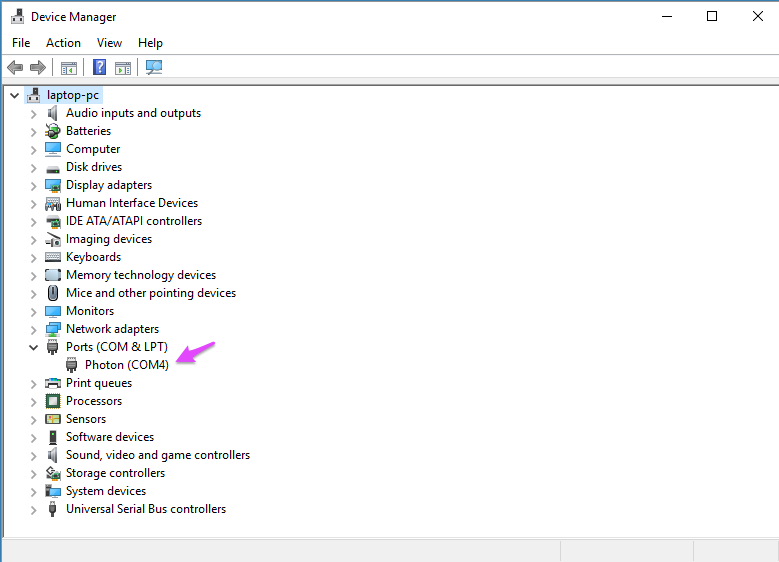
It's hard to say what COM port your Photon or Electron will use, but if you open the Windows Device Manager and expand Ports (COM & LPT) it should show the device.
This is the configuration screen for PuTTY:
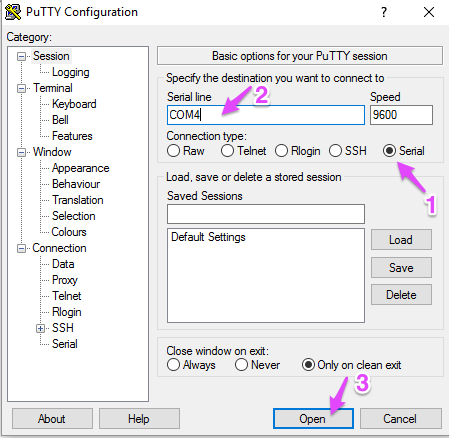
Click Serial (1) then enter the COM port number (2) then click Open (3).
Mac
Find the serial port that is being used using the Terminal program command line:
ls /dev/cu.usb*
It should return something like /dev/cu.usbmodemFD1161.
Then issue the command:
screen /dev/cu.usbmodemFD1161
Screen allows you you both send characters to the Photon or Electron as well as receive them from the USB serial device.
To close (kill) a screen session, press Ctrl-A then press k.
Linux
Find the serial port that is being used using the Terminal program command line:
ls /dev/ttyACM*
It should return something like /dev/ttyACM0.
Then issue the command:
screen /dev/ttyACM0
Screen allows you you both send characters to the Photon or Electron as well as receive them from the USB serial device.
To close (kill) a screen session, press Ctrl-A then press k.
Web serial
If you are using the Chrome web browser (version 89 or higher) on Windows, Mac, Linux, or Chromebook, you can use the web-based USB serial monitor.
This is particularly useful if you have a Chromebook, or cannot install additional software on your computer.
The button below will open a new tab, as you will probably want to be able to use other things like the Web IDE and documentation at the same time.
User firmware
Here's simple firmware you can flash to your device to test USB serial output:
In depth
#include "Particle.h"
This line is only required for .cpp files, not for .ino files. Since it doesn't hurt and is sometimes required, it's easy to just always add it.
SerialLogHandler logHandler;
This line sets up the serial log handler. This is the the preferred way to output serial debug logs. You can learn more here.
- Using the log handler you can adjust the verbosity from a single statement in your code, including setting the logging level per module at different levels.
- Using the log handler you can redirect the logs between USB serial and UART serial with one line of code.
- Other logging handlers allow you to store logs on SD cards, to a network service like syslog, or to a cloud-based service like Solarwinds Papertrail.
Being able to switch from USB to UART serial is especially helpful if you are using sleep modes. Because USB serial disconnects on sleep, it can take several seconds for it to reconnect to your computer. By using UART serial (Serial1, for example) with a USB to TTL serial converter, the USB serial will stay connected to the adapter so you can begin logging immediately upon wake.
#ifndef SYSTEM_VERSION_v620
SYSTEM_THREAD(ENABLED); // System thread defaults to on in 6.2.0 and later and this line is not required
#endif
This line enables system threaded mode. It allows your code to run before connected to the cloud, such as when blinking green or cyan. You can learn more here.
const std::chrono::milliseconds logPeriod = 5s;
unsigned long lastLog;
int counter;
These lines are part of the code that periodically prints output. The first line is how
often to generate messages. In this case, 5 seconds (5s). You could change this to
10s (10 seconds), 500ms (500 milliseconds), or 1min (1 minute).
void setup() {
}
There's nothing to set up here. Sometimes you'll see Serial.begin() here, but it's not
necessary if you are using SerialLogHandler.
void loop() {
    if (Network.listening()) {
        return;
    }
This is not always necessary, but one thing to beware of: When using system thread mode, your code also runs when in listening mode (blinking dark blue).
If you are continuously writing to the USB
serial port from your code, you can prevent listening mode (blinking dark blue) from
working properly. This will affect commands like particle identify.
Avoiding output when in listening mode allows these commands to work properly.
    if (millis() - lastLog >= logPeriod.count()) {
        lastLog = millis();
This code handled executing the inner part of the if at a predefined interval
set in logPeriod above. The default is every 5 seconds (5s) but you can change
the code to other values.
        Log.info("counter=%d", ++counter);
    }
}
And finally, this outputs a message.
If you are monitoring the serial output, you should see something like this:
0000010001 [app] INFO: counter=2
0000015001 [app] INFO: counter=3
0000020001 [app] INFO: counter=4
0000025001 [app] INFO: counter=5
The leftmost column is a timestamp in milliseconds.
The second column is what module
generated the message. You might also see [system] or [comm.protocol] here.
The third column is the log level. What do you think would happen if you changed the code to be:
Log.error("counter=%d", ++counter);
Other logging methods can be found here.
More examples
The example above uses this code:
Log.info("counter=%d", ++counter);
There's actually a lot going on here.
Log.infocan also beLog.error,Log.warnorLog.tracedepending on the severity of the message."counter=%d"is asprintfformatting string.++counterare the variable arguments tosprintf. In this case, the global variablecounteris incremented on every use.
Log.trace is not printed by default, so that's good choice for more detailed debugging.
See Customizing log levels, below, for more information.
Here are some more examples of logging statements and their expected output:
Log.info("staring test millis=%lu", millis());
// 0000068727 [app] INFO: staring test millis=68727

// To print an int as decimal, use %d
Log.info("counter=%d", ++counter);
// 0000068728 [app] INFO: counter=1

// To print an int as hexadecimal, use %x
int value1 = 1234;
Log.info("value1=%d value1=%x (hex)", value1, value1);
// 0000068728 [app] INFO: value1=1234 value1=4d2 (hex)

// To print a string, use %s
const char *testStr1 = "testing 1, 2, 3";
Log.info("value1=%d testStr=%s", value1, testStr1);
// 0000068728 [app] INFO: value1=1234 testStr=testing 1, 2, 3

// To print a long integer, use %ld, %lx, etc.
long value2 = 123456789;
Log.info("value2=%ld value2=%lx (hex)", value2, value2);
// 0000068729 [app] INFO: value2=123456789 value2=75bcd15 (hex)

// To print to a fixed number of places with leading zeros:
Log.info("value2=%08lx (hex, 8 digits, with leading zeros)", value2);
// 0000068729 [app] INFO: value2=075bcd15 (hex, 8 digits, with leading zeros)

// To print an unsigned long integer (uint32_t), use %lu or %lx
uint32_t value3 = 0xaabbccdd;
Log.info("value3=%lu value3=%lx (hex)", value3, value3);
// 0000068730 [app] INFO: value3=2864434397 value3=aabbccdd (hex)

// To print a floating point number, use %f
float value4 = 1234.5;
Log.info("value4=%f", value4);
// 0000068730 [app] INFO: value4=1234.500000

// To print a double floating point, use %lf
double value5 = 1234.333;
Log.info("value5=%lf", value5);
//  0000068731 [app] INFO: value5=1234.333000

// To limit the number of decimal places:
Log.info("value5=%.2lf (to two decimal places)", value5);
// 0000068732 [app] INFO: value5=1234.33 (to two decimal places)
Any time you are printing a String object from Log.info you must do it like this:
String myString = "testing!";
Log.info("message: %s", myString.c_str());

// Print my local IP address (Photon, P1, and Argon):
Log.info("ip address: %s", WiFi.localIP().toString().c_str());
- Note the use of
%sfor a string - You must add the
.c_str()at the end, otherwise it will print garbage characters!
The reason is that with variable arguments, the compiler does not know you want the
c-string version (null terminated, compatible with %s). You can also do it this way
if you prefer:
Log.info("ip address: %s", (const char *) WiFi.localIP().toString();
If you want to log a MAC address (hardware address, used with Wi-Fi, Ethernet, and BLE), you can print the normal hex format by using:
uint8_t addr[6];
Ethernet.macAddress(addr);

Log.info("mac: %02x-%02x-%02x-%02x-%02x-%02x",
    addr[0], addr[1], addr[2], addr[3], addr[4], addr[5]);
Sprintf-style formatting, including Log.info() etc. does not support 64-bit integers. It does not support %lld, %llu or Microsoft-style %I64d or %I64u. As a workaround you can use the Print64 firmware library in the community libraries. The source and instructions can be found in GitHub. This can happen if you want to print the event code for a System Event Handler which is type system_event_t which is 64-bits wide.
You can learn more about sprintf here.
These messages are limited to 200 characters and are truncated if longer.
If you want to use write longer data, you can use Log.print(str) which takes a pointer to a null-terminated c-string. Note that the output does not include the timestamp, category, and level, so you may want to precede it with Log.info(), etc. but is not length-limited. You cannot use printf-style formatting with Log.print().
You can also print data in hexadecimal using Log.dump(ptr, len) to print a buffer in hex as specified by pointer and length. It also does not include the timestamp, category, and level.
Two-way USB serial
Often you will only use USB serial to output message from your program. In fact, the
particle serial monitor is really only a monitor and you cannot type back to the device.
Sometimes you will want to interact with your program, and it is possible to do two-way
communication using programs like screen (Mac or Linux) or PuTTY and CoolTerm (Windows).
You can also use the Arduino IDE as a two-way serial program.
It will print messages received in the USB serial debug output like this:
0000190001 [app] INFO: counter=38
0000195001 [app] INFO: counter=39
0000195304 [app] INFO: received Testing!
0000200001 [app] INFO: counter=40
Customizing log levels
In the example above we used this statement:
SerialLogHandler logHandler;
A common variation is to specify the level:
SerialLogHandler logHandler(LOG_LEVEL_TRACE);
Setting the level to
LOG_LEVEL_TRACEincludes allLog.trace,Log.info,Log.warn, andLog.error.The default if you do not specify is
LOG_LEVEL_INFO.
| Level |
|---|
LOG_LEVEL_TRACE |
LOG_LEVEL_INFO |
LOG_LEVEL_WARN |
LOG_LEVEL_ERROR |
The Tracker Edge firmware includes this:
SerialLogHandler logHandler(115200, LOG_LEVEL_TRACE, {
    { "app.gps.nmea", LOG_LEVEL_INFO },
    { "app.gps.ubx",  LOG_LEVEL_INFO },
    { "ncp.at", LOG_LEVEL_INFO },
    { "net.ppp.client", LOG_LEVEL_INFO },
});
- The 115200 is optional, as the baud rate is ignored. It's there so you can change it to be a
Serial1LogHandlerwith a 1-character change and have it work with hardware UART serial. - It sets the default log level to
LOG_LEVEL_TRACE. - For the category "app.gps.nmea" (the GPS library), it sets the level to
LOG_LEVEL_INFOas the logs are too verbose atLOG_LEVEL_TRACEunless you are debugging a GPS issue. - Same for the other categories, feel free to add more.
You may also want to go the other way, and set the default to LOG_LEVEL_INFO and increase
it for specific modules you want detailed debugging on.
SerialLogHandler logHandler(115200, LOG_LEVEL_INFO, {
    { "app.mymodule", LOG_LEVEL_TRACE },
});
UART serial
The USB serial debug is great, but there are a few cases where it's less convenient. One is when using sleep modes. When the Particle devices goes to sleep, USB is disconnected. When you wake up, it can take a while (a few seconds on Mac or Linux, as many as 8 seconds on Windows) to reconnect.
One solution to this is to use UART serial, hardware serial, for example Serial1 on the
TX and RX pins, if you are not already using it in your project.
You'll need a converter:
Converters
There are a number of USB to TTL serial converters available. This one from Sparkfun works well with Particle devices; it's fully compatible and has a micro-USB connector like the Photon, Electron, Argon, and Boron. It works without additional drivers on Mac and Linux and there are drivers available for Windows.
There are many other options, however:
- Make sure your converter is a 3.3V TTL serial converter.
- Absolutely not an RS232 converter - that will permanently damage your Particle device!
FT232is a good search term. It's the name of FTDI chip in many of these converters.- There are other chipsets like the CH340 that also work fine.
A 5V TTL converter will probably work Particle Device TX to converter RX, but never connect a 5V TX to an Argon or Boron RX pin! Gen 3 Particle devices are not 5V tolerant. Using a 3.3V serial converter is a safer option.
Particle Debugger
The Particle Debugger is also a 3.3V TTL serial converter!
- The 10-pin ribbon cable does not connect TX and RX.
- Connect
TXon the Photon, Electron, Argon, Boron, etc. toRXon the Particle Debugger. - Optionally connect
RXon the Particle device toTXon the Particle Debugger if you need two-way communication. - Make sure you match the baud rates.
Otii Arc
The Qoitech Otii Arc is a programmable power supply that is great for testing power consumption on Particle devices.
An additional benefit is that is has an available TTL serial connection. You can connect the
TX output of the Particle device to RX on the Arc, and it will correlate the time of the
serial output with the power consumption!
User firmware
In your user firmware, you'll need to enable Serial1 output. For example:
Serial1LogHandler uartLogHandler(115200);
Make sure you match the baud rate! Another common setting is 9600:
Serial1LogHandler uartLogHandler(9600);
You can enable both USB and UART serial output at the same time:
SerialLogHandler logHandler;
Serial1LogHandler uartLogHandler(115200);
You can also choose different log levels based on the destination logger:
SerialLogHandler logHandler(LOG_LEVEL_INFO);
Serial1LogHandler uartLogHandler(115200, LOG_LEVEL_TRACE);
Learn more
- Device OS Serial Reference
- Device OS Logging Reference
- More about serial including hardware UART ports