
Fleet health
As you begin deploying more connected devices in the field powered by Particle, it is important to have tools that give visibility into the overall functioning of the IoT fleet. These tools allow your team to effectively identify and respond to any system-wide disruptions that may occur.
Fleet Health is a collection of metrics that provides a bird's-eye view of the health of an IoT system. These metrics are gathered for all devices in a Product fleet, and displayed as interactive graphs in the Particle Console. When a problem does arise, Fleet Health will allow your team to proactively recognize and respond to it — as opposed to waiting for your customers to inform you of a degraded experience. The available metrics provide insight into critical components of a healthy system, which results in rapid root-causing (and thus, faster resolution times) of any disruption to IoT devices.
Fleet Health is meant to complement Device Vitals as part of the Diagnostics suite of tools available to you. The aggregated, top-down visibility provided by Fleet Health can be used in tandem with the detailed device-level diagnostics Device Vitals offers.
Available metrics
Fleet Health collects the metrics that matter most when keeping device deployments online and operating normally. The available metrics instrument various critical components of the IoT infrastructure supporting your application that all need to function properly for a healthy fleet.
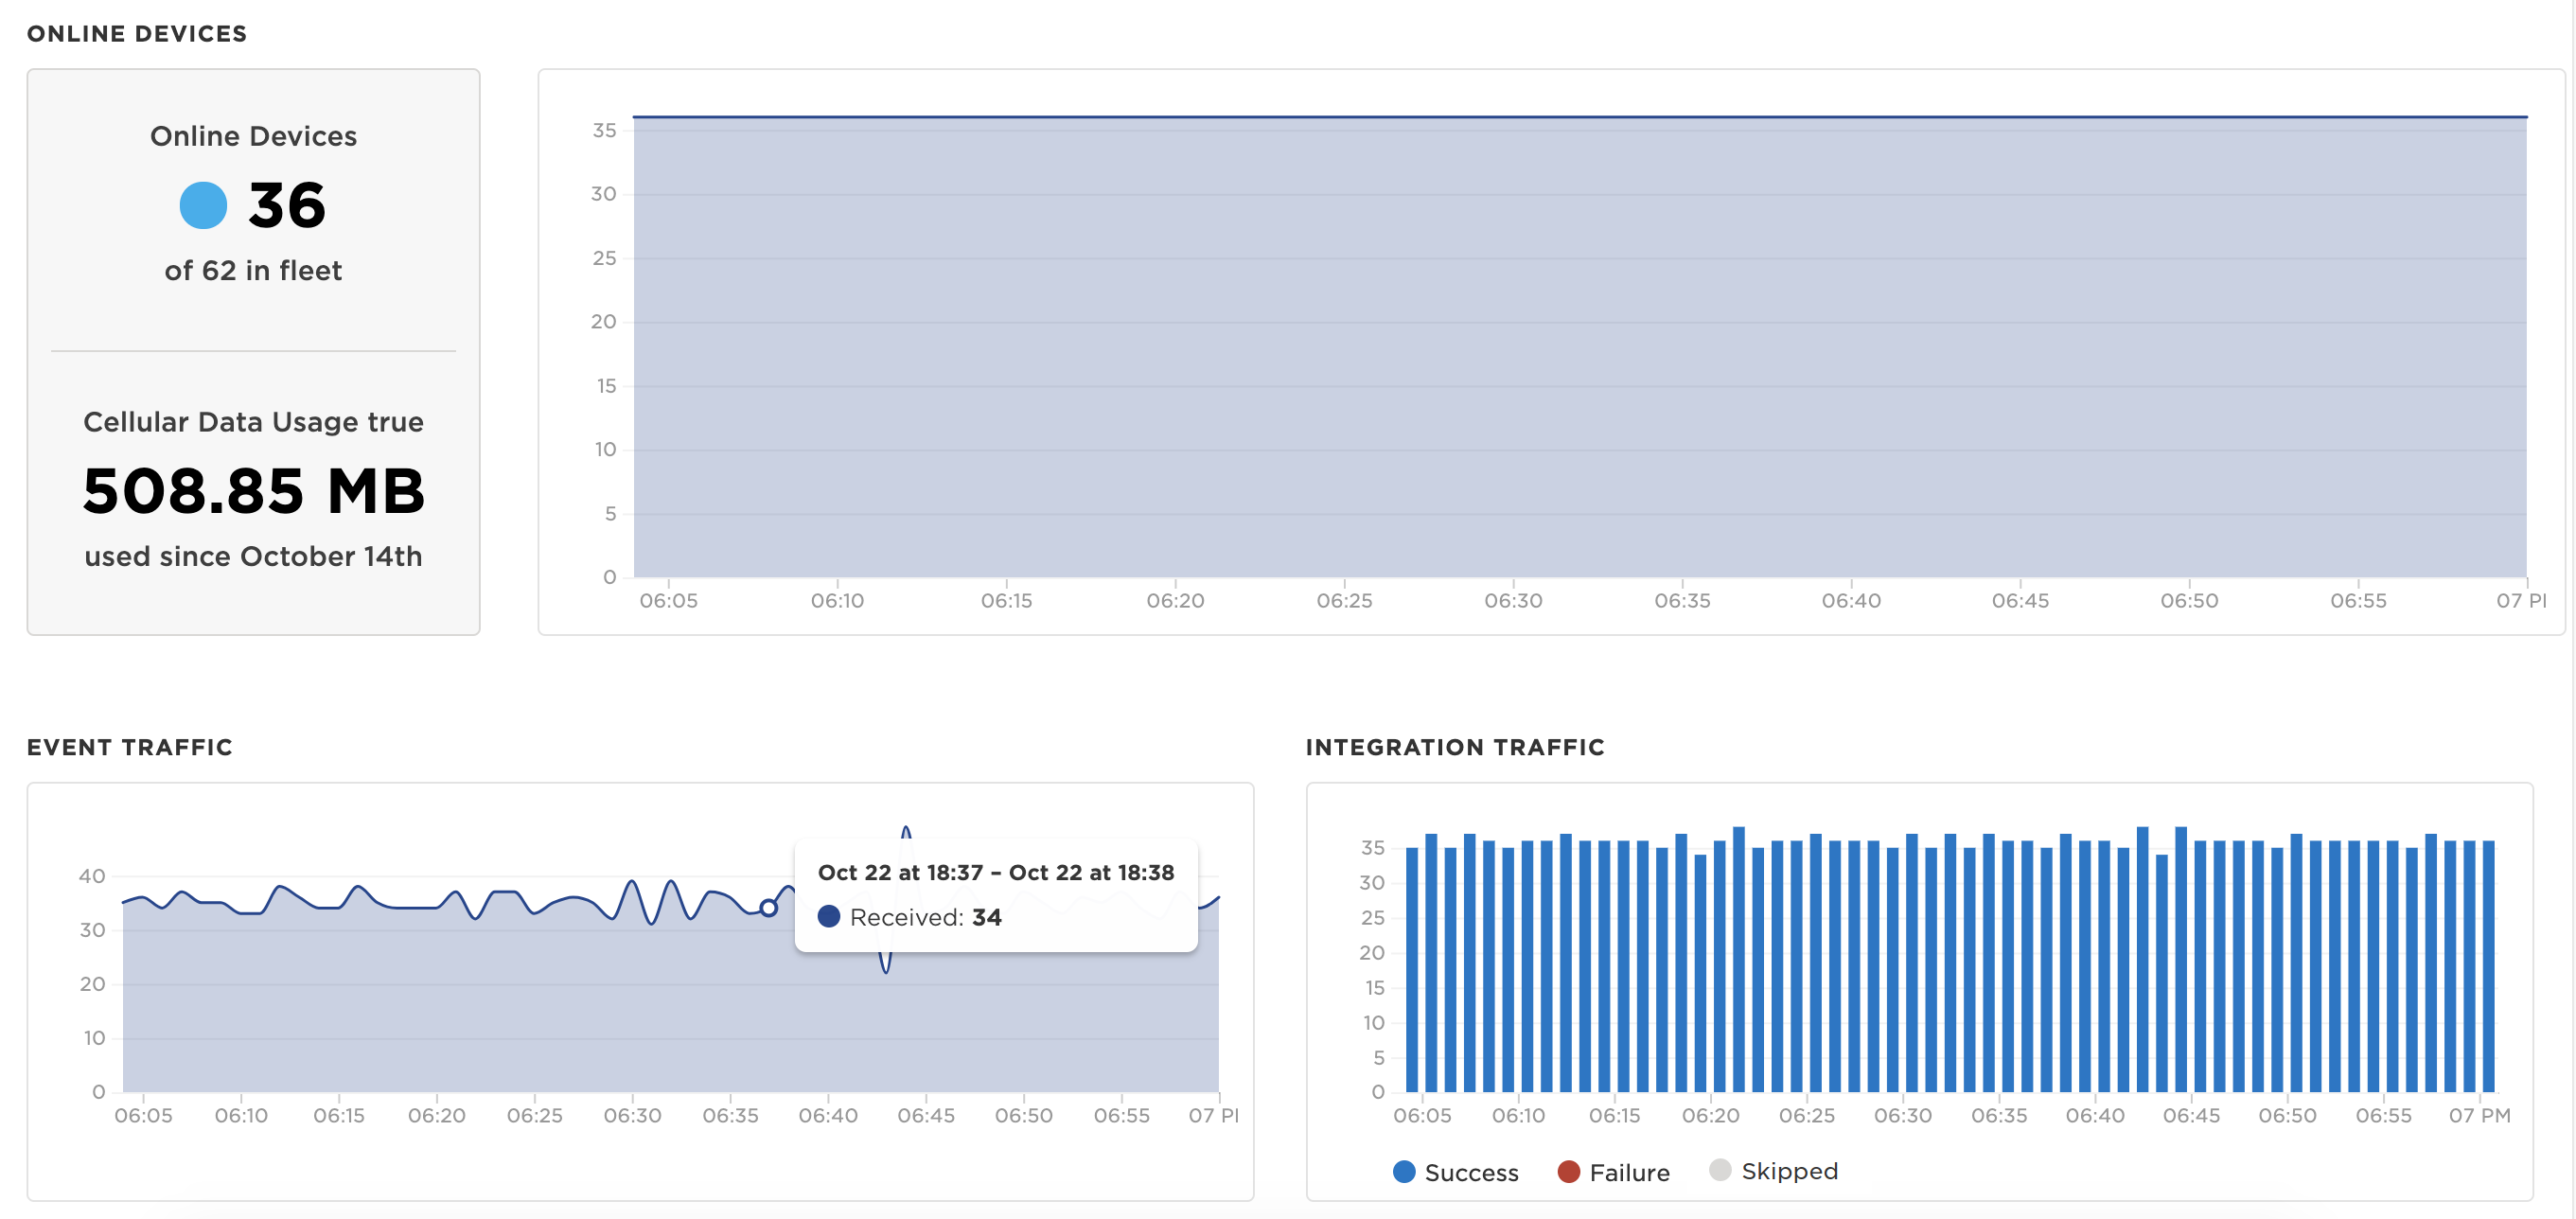
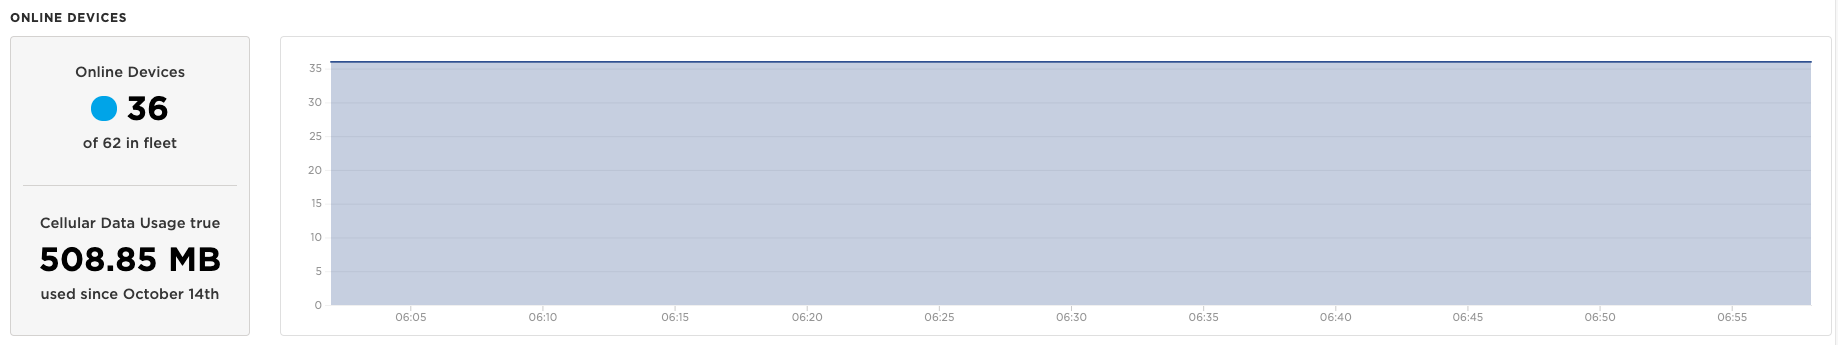
Online devices
One of the most common questions you as a fleet manager likely have is: How many devices are online right now? And relatedly, How do the number of online devices right now compare to historical totals?
Fleet Health includes three different metrics related to online devices:
- Devices currently online: The number of Particle devices in your fleet currently connected to the Device Cloud.
- Online devices over time: Periodic snapshots of the fleet are taken to capture how many devices were online and connected at different points in time.
- Cellular data usage: How many MBs of cellular data was consumed by the fleet in the current period. Only displayed for Products that include cellular devices.
Event traffic
One of the 4 main device communication primitives is publishing
events, which is done by adding
Particle.publish()
to application firmware. Publishing events allows devices to send a
message to the Device Cloud (i.e. the current location of an
asset), which can be subscribed to by downstream systems.
The Event Traffic metric measures How many events have been published by my device fleet over time?
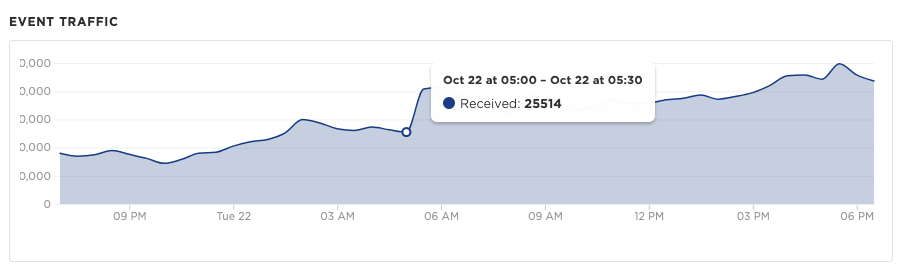
Specifically, this metric observes published events sent by devices to the Particle Device Cloud. As published events trigger Integrations (see next metric below) to forward telemetry data to other systems, this is often a critical component of a healthily functioning deployment.
Integration traffic
Integrations represent secure channels that allow telemetry data to flow from the Particle Device Cloud to other systems, like CRMs, ERPs, and customer-facing IoT applications.
The Integration Traffic metric measures How many messages from devices in the fleet were sent to destination servers via Integrations? What percentage of those have been successful?
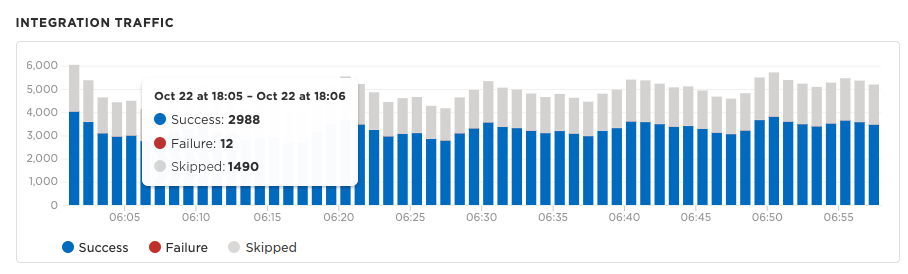
This metric aggregates all configured Integrations for your Product. For instance, if you have 2 Webhooks and an Azure Integration set up, the Integration Traffic metric will sum the performance of all three.
Delivery of each event will be attempted 3 times. The Integration Traffic metric shows the final outcome so one failure means one event that was dropped without being delivered after 3 attempts. In cases where there are many failures in rapid succession, the Particle Cloud will skip sending some events to decrease the pressure on the receiving server.
An elevated failure rate would suggest that events are being published successfully, but one or more Integrations are not accepting requests from the Particle Device Cloud. If you experience high error rates, you should examine each Integration's history and logs to identify which one is having an issue.
Cloud function calls
Another device communication primitive is Cloud Functions, which are
exposed using
Particle.function()
in application firmware. Cloud Functions allow you to instruct devices
to take an action remotely.
The Cloud Function Calls metric measures How many cloud function calls have been made to my devices? What percentage of those have been successful?
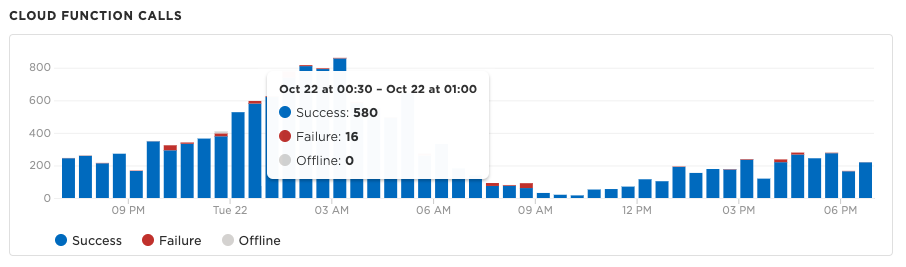
An elevated error rate here suggests that attempts to reach devices from the cloud (i.e. via an API call) are failing. This is most often correlated with devices losing connectivity with the Device Cloud, making them unreachable remotely. Be sure to cross-reference this metric with the Online Devices data.
Cloud variable requests
Cloud Variables is another device communication primitive that
allows you to query devices for information locally. Variables are
exposed using
Particle.variable()
in application firmware.
The Cloud Variable Requests metric measures How many cloud variable requests have been made to my devices? What percentage of those have been successful?
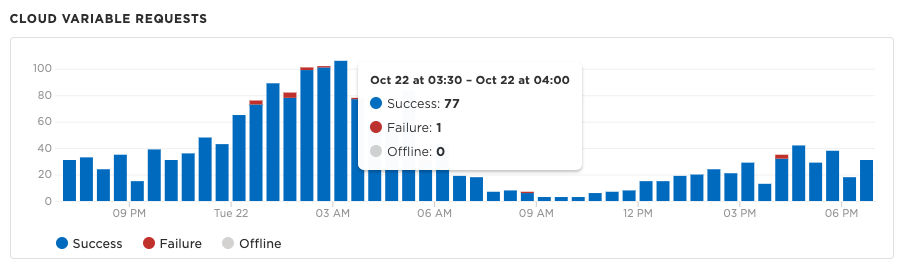
Like the Cloud Function Calls metric, an increase in errors would represent attempts to reach devices from the cloud are failing. Be sure to also cross-reference this metric with the Online Devices data.
Manipulating the data
By default, Fleet Health displays metrics for an entire Product fleet, and in the last 30 minutes. When doing deeper analysis, there are tools available to slice the data across different characteristics.
Date range selection
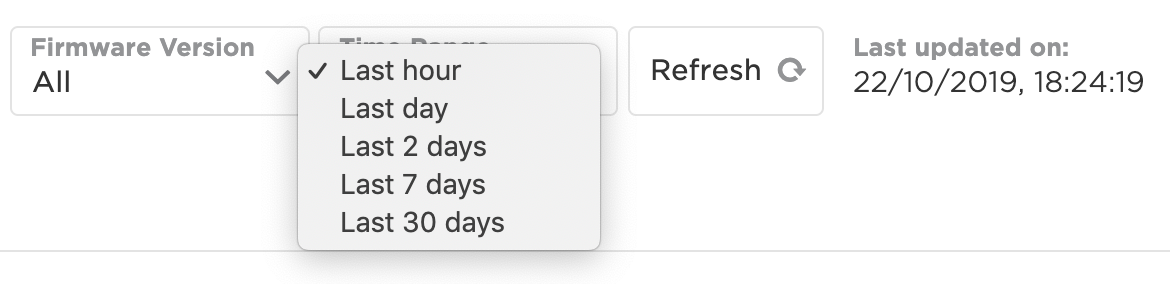
It can be helpful to examine Fleet Health metrics collected at different time intervals. For instance, if doing a postmortem on a disruption, you would want to go back to look at the time period in question.
You can use the Date Range selector to change the time window for all recorded time-series metrics. You can choose from a few Preset Ranges.
Note that when you change the date range, there will also be a corresponding change in the bucketing of metrics. That is, each tickmark on the x-axis representing a window of time will be updated. The longer the range, the wider window of time each data point will include.
Metric filtering
When performing analysis on potential disruptions, it may be the case that only a subset of the fleet is actually impacted. Fleet Health equips you with powerful filtering tools to isolate a problem to subsets of devices.

Use filters to examine subsets of devices for connectivity health insights
By device group
Each metric can be filtered to display data from devices belonging to a specific group. This can help you, for instance, understand that a decrease in online devices is because of a localized cellular outage for units deployed in a certain geographic area, grouped by location in the Console.
By firmware version
Similarly, Fleet Health metrics can be focused on a specific version of
Product application firmware. It may be the case that a new version of
firmware you have released to the fleet has caused unintended
consequences on the ability for devices to successfully communicate with
the cloud. For instance, perhaps a bug was introduced between v2 and
v3 of application firmware causing calls to a Particle.function() to
fail.
By Device OS version
Lastly, it may be that devices running different versions of Device OS are exhibiting different behaviors. Filtering by Device OS version can help you identify patterns in connectivity health across Device OS versions running on devices in the fleet.
Fleet health was previously only available to Enterprise customers but is now available to all products.