
Troubleshooting the Particle Workbench
For questions with respect to the installation of Particle Workbench, please see our Workbench Tutorial (link). The Tutorial goes deep, with resources about many lesser-known Workbench features.
It is generally worth also reviewing the troubleshooting documentation available by running the command Particle: Get Help in the Workbench Command Palette (⇧⌃P (Windows, Linux) or ⇧⌘P (Mac OS).
Running a basic workbench functionality check
Before troubleshooting further, please take the following steps to ensure Workbench's basic operations are functional:
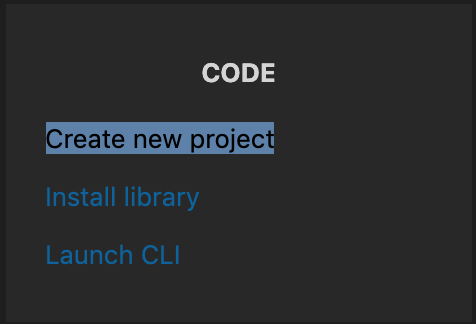
- Create a new project in Workbench by using the "Create Project" command in the development workflow UI:
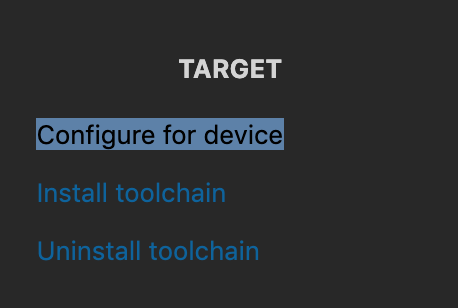
- Leave the .ino file blank (a blank sketch) and use the "Configure for Device" command to configure this blank sketch for a Particle device you have in your possession:
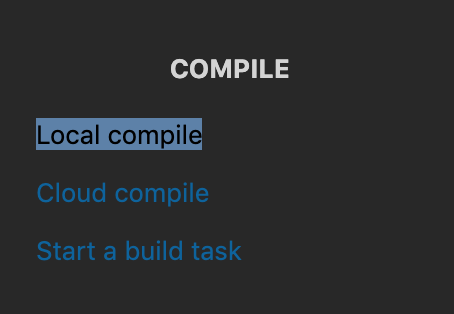
- Compile this blank firmware (this may take a few minutes):
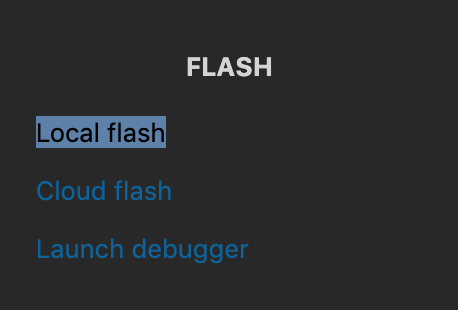
- Connect your device via USB and attempt to flash this blank firmware to it:
If all of the above work without an issue, it's worth taking a look at the configuration of the user application and project layout for which you received errors/failures. Again, we'd like to refer you to the documentation available here (link).
If, however, you receive errors in one or all of the above stages, proceed by c ollecting an Environment Report. Go to the Workbench Command Palette (⇧⌃P (Windows, Linux) or ⇧⌘P (Mac OS)) and select Particle: Audit Environment.
Take a look at the following elements of your Environment Report:
- Your username field (
"username") should match your Particle Account ID. "hasValidPath": trueindicates that your Workbench installation is installed at a location with the filepath requirements necessary for Workbench to operate (no whitespace or emojis in your user directory).- In the section beginning with
"cli":look for"ok": true- if this returns false, there is an issue with the underlying CLI installation through which Workbench performs many key functions. - In the section beginning with
"localCompiler":look for"ok": true. - In the section beginning with
"platform":check that"arch"doesn't indicate an x86 architecture, which is currently unsupported.
Keeping this in mind, proceed with the following troubleshooting steps.
Ensuring Particle workbench is properly installed and configured for your system
Issues related to build tools can be complex! After all, every computer is configured differently and is governed by unique administrative permissions schema, firewalls, networking settings, etc.... The majority of Workbench issues are related to this complexity, so taking a step back and ensuring your tools are installed and configured properly is an important step to the troubleshooting process.
Note - as a general principle we do not recommend uninstalling/reinstalling Workbench and VSCode. If possible please refrain from doing so and instead focus on the workflow below:
- Verify you are using the latest version of Particle Workbench - there’s a decent chance we’ve already fixed your issue. In most cases, Particle Workbench will auto-update, so pay attention to a dialog box on the bottom right of the Workbench window prompting you to update. If you have not seen this box in awhile, or if you are concerned that you may have disabled this functionality, follow the instructions here to update your Workbench extension: (link).
- Further, verify that you are using the latest version of Visual Studio Code. Follow the instructions here: (link) to ensure that VSCode will auto-update correctly.
- Reset your Workbench Instance - Open up the Workbench Command Palette (⇧⌃P (Windows, Linux) or ⇧⌘P (Mac OS) and run the command
Particle: Reset Environment. - Disable any other extensions that may be active within your VSCode instance. On occasion, new developments in other extensions can impact or interfere with the performance of this (and other) extensions. You can find more information about how to do so here: (link).
- Disable Antivirus Software - some antivirus programs interfere with the CLI. During the course of troubleshooting, it is important to temporarily disable or explicitly grant higher privileges in your firewall interface to confirm your issue is still present.
- Likewise, temporarily disable any VPNs through which you may be networking and confirm that your issue is still present.
- Avoid Cloud Storage Drives targeting a project in a Dropbox / OneDrive / Google Drive directory. Ensure the CLI has been installed within a standard directory to which you have the appropriate permissions.
- On Mac and Linux, if Workbench is installed within a user directory, ensure there is no whitespace within the filepath of that directory (e.g. /Users/Particle Support/).
- Avoid Custom Shell Commands - Local compilation on Mac OS & Linux relies on a number of standard shell commands (e.g.
cd,ls,rm,stat, etc...). In rare cases a developer may choose to replace these standard built-in commands with custom versions that behave differently. Verify you are not using custom shell commands or disable them temporarily and re-test your issue. - UNABLE_TO_GET_ISSUER_CERT_LOCALLY error - This is due to Node.js security and can occur after upgrading the Node.js. When connecting to the NPM Registry, the error is "fetchPackageMetaData error for particle-cli@latest request to https://registry.npmjs.org/particle-cli failed, reason: unable to get local issuer certificate".
- Open a terminal within VSCode or open a Windows Command Prompt (you may need to run the Windows Node Terminal, depending on your setup). Run the command: npm config set strict-ssl false
- Scroll to the bottom of this page and follow the steps for issue reporting.
Steps to take if you encounter an Intellisense issue
An Intellisense issue can manifest in a number of ways, sometimes by incorrectly flagging missing headers, sometimes through red underscoring under correctly defined/implemented code:
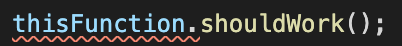
or through any number of warnings or other errors reported (some which may invoke Intellisense directly). Important: if your application compiles without issue, these errors and or warnings should be considered benign and can be ignored. Follow the steps below before reporting an issue, ensuring after each step that Intellisense errors are still being flagged in the Problems tab of Workbench:
- Confirm you are working within a Particle project created via the
Particle: Create Projectcommand. - Close and re-open your project.
- Close and re-open VSCode.
- Check the version of the C/C++ extension installed with VSCode (link).
NOTE: if you are running an “insiders” build, rollback to a non-prerelease version (link) and make sure to opt-out of the “insiders” channel in your user-level settings (link). - Run the
C/C++: Reset Intellisense Databasecommand (⇧⌃P (Windows, Linux) or ⇧⌘P (Mac OS), then start typing the command and it should autopopulate). - Try adding
"C_Cpp.loggingLevel": "Debug"to your project’s./vscode/settings.jsonfile (or use VSCode’s UI - File -> Preferences -> Settings and then search for “logging level”).. - Verify that your project
settings.jsonincludes"C_Cpp.default.configurationProvider": "particle.particle-vscode-core". - Scroll to the bottom of this page and follow the steps for issue reporting.
Steps to take if workbench does not recognize your device
Hardware peripheral issues have several main causes. In order:
- Investigate your USB cable. 90%+ of cases where Workbench cannot detect your device result from two major cable issues. First, make sure your USB cable is a data cable (not simply a power cable). There are, unfortunately, no conventions around labeling cables as data cables or power cables - the easiest way to ensure your USB cable is in fact a data cable is to attempt to transmit data to it. We recommend cross-testing against another device and against another cable. Following the PuTTY/CoolTerm instructions here (link) is an easy way to test a viable USB serial connection to your device without using Workbench.
- Make sure your USB cable is not damaged in some way. Again, cross-testing against another device and against another cable is strongly recommended.
- Bypass USB hub / extensions - if you are working with a device and are seeing issues related to its USB connection, try disconnecting all USB devices and reconnecting only your Particle device directly to you computer’s USB port.
- For Windows devices, you may need to ensure that the appropriate drivers are installed. IF you see the error
LIBUSB_ERROR_NOT_SUPPORTED, you may need to install the latest Particle USB/serial drivers. Please see our extensive troubleshooting documentation for fixing Windows driver issues here: (link). - Check your computer's Device Manager to ensure that your computer is able to identify the device. For Mac OS, you will need to go to
Applications/Utilitiesand open up the application called "System Information." For Windows, this is your Device Manager.
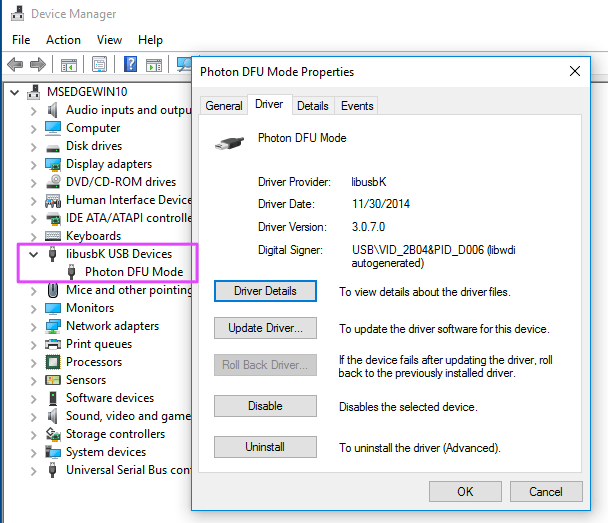
When in DFU mode, the Device Manager looks like this: (Note that it may say Photon DFU Mode regardless of device type.)
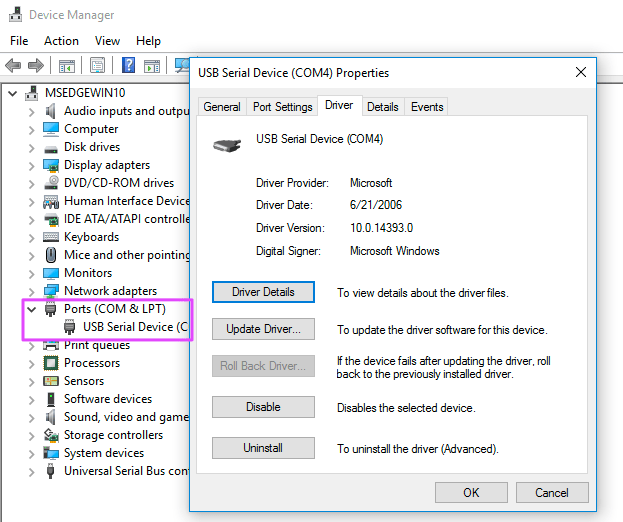
And when in normal operating mode or listening mode (blinking blue), the Device Manager looks like this:
- If your device is recognized in DFU Mode but not in any other mode, you may need to perform an update to that device in order for it to recognize Serial commands. In order to do so, as always, place the device in DFU Mode (hold down BOTH buttons, then release only the
RESETbutton, while holding down theMODEbutton. Wait for the LED to start flashing yellow (it will flash magenta first) and release theMODEbutton once it's flashing yellow). Then run the CLI commandsparticle updatefollowed byparticle flash --local tinker..
Workbench network error
Network Errors indicating that api.particle.io is not accessible are usually caused by restrictive network policies. Please contact your IT to enable access to api.particle.io. This error can appear when you run or other similar commands:
particle library upload
Working with a custom DeviceOS build
It's possible to work with a non-released branch, fork, or manually merged PRs of Device OS.
- Get the latest Device OS source from GitHub. You'll need to have the command line version of git available in order to retrieve the submodules.
git clone https://github.com/particle-iot/device-os
cd ./device-os
git checkout develop
git submodule update --init --recursive
- Launch Visual Studio Code
- Navigate to your Particle settings (docs) and set the
Custom Device OS Location
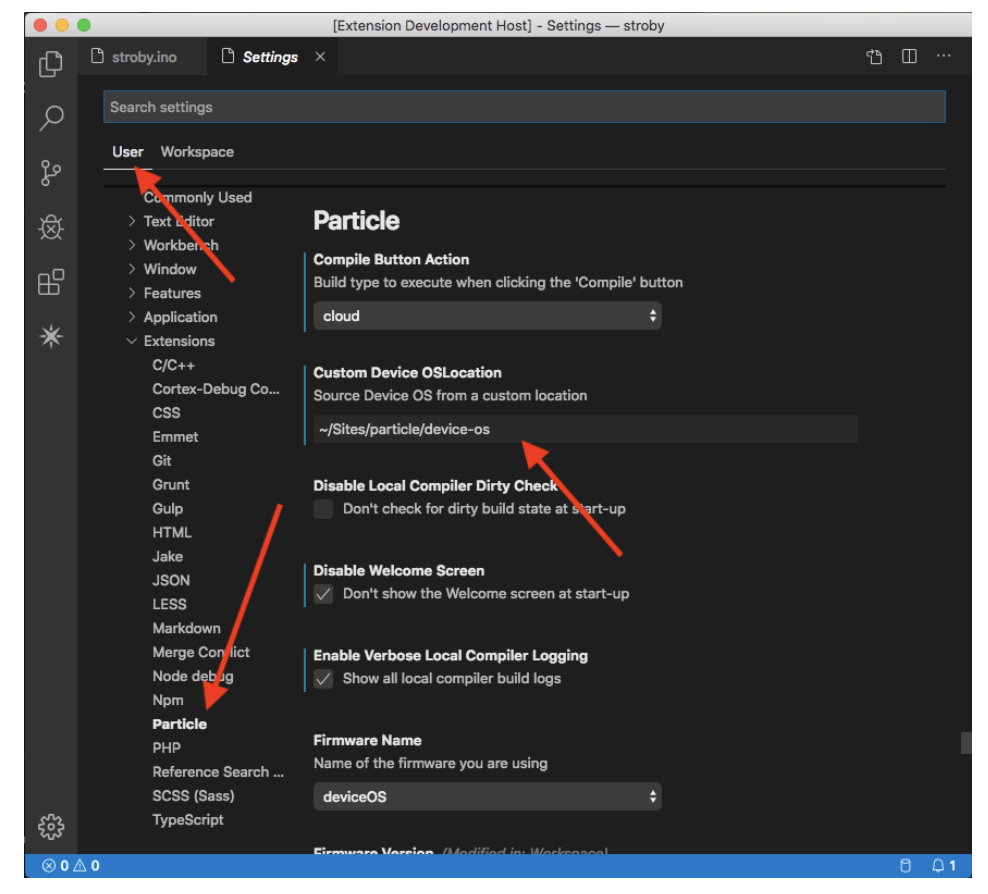
- Enter the absolute path to your Device OS source code and reload when prompted
- Open a Particle project and open a source file
- Click on the Device OS entry in the status bar to display a list of available toolchains
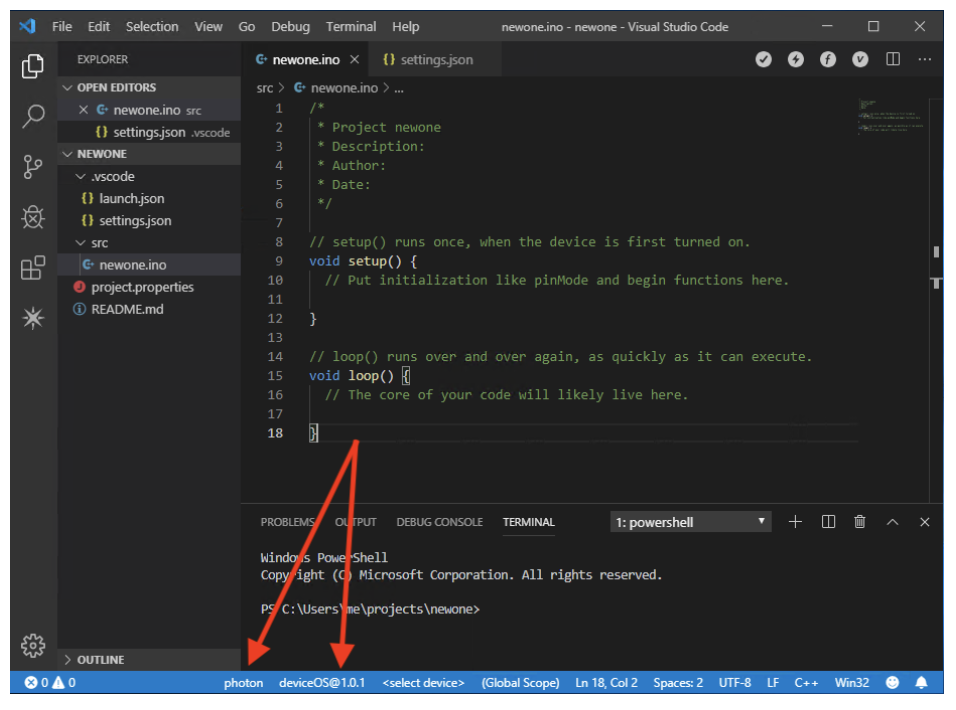
- Select the
deviceOS@sourceentry - it should be first in the list - Wait for the toolchain to install and activate
- Run commands (docs) and local compilation tasks as normal (docs)
Unable to load manifest error
Unable to load manifest for: ~/path/to/device-os - attempted to load: ~/path/to/device-os/.workbench/manifest.json
Workbench attempts to load a manifest located within the Device OS source repository. If that file isn't available or if you've somehow incorrectly set the Custom Device OS Location setting, you'll see this error.
Uninstalling Workbench
- Open VSCode.
- Click the Extensions button on the left toolbar (Activity bar).
- Click on the gear icon for the Workbench extension and select Uninstall.
- Repeat for the C/C++ and Cortex-Debug extensions
- Close and re-open VSCode, then close it again.
- Delete the
~/.particle/toolchainsdirectory.
Uninstalling VSCode
Mac
- Find your
Visual Studio Code.appfile (typically in~/Applicationsor/Applications) - Delete
Visual Studio Code.app
Windows
- Open Add/Remove Programs.
- Select Microsoft Visual Studio Code and click the Uninstall button
Linux
- Open a terminal
- Run
sudo apt-get purge code. This currently only works with Ubuntu and other Debian-style distributions.
Linux Tips
- On 64-bit Linux you may need to install 32-bit libraries:
sudo apt-get install gcc-multilib libarchive-zip-perl libncurses-dev
- If you get a permission error when debugging, you may need to add udev rules.
- If you have the Particle Workbench, run the
Particle: Launch CLIcommand and then runparticle usb configurein the terminal that launches - if you just have the Particle CLI, open a terminal and run
particle usb configure - Otherwise, you can download 50-particle.rules and copy it to
/etc/udev/rules.d/, then unplug and replug your device.
- If you have the Particle Workbench, run the
How to report workbench issues
Particle's Support Team refers CLI and Workbench issues to our Particle Community (link) . There are several benefits to doing so - other members of our Community may already have a solution for this issue, it allows for more transparent self-service after your issue is resolved, and it also is an often direct channel to our CLI and Workbench Engineering Team. In order to report your issue, please post in our Particle Community (link) following the instructions below:
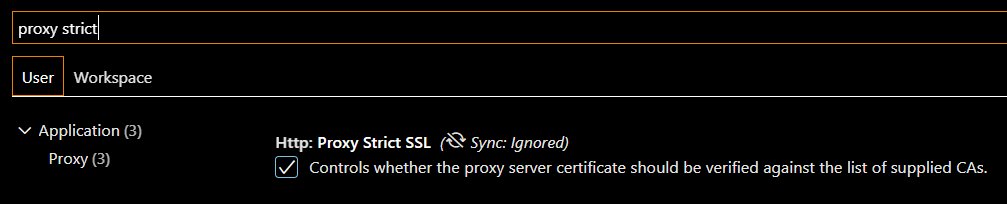
- Capture verbose error logs of the incident in question. In order to activate verbose logging on your Workbench instance, go to Code -> Preferences -> Settings. Select "Extensions" from the menu that appears, scroll down to Particle and ensure the following box is selected:
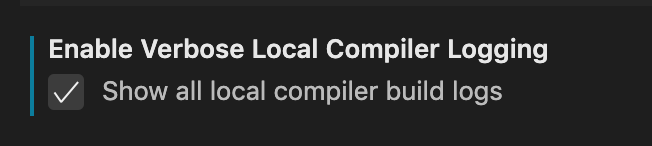
Re-run any commands that have resulted in errors and collect them into your report.
- Collect an Environment Report by going to the Workbench Command Palette (⇧⌃P (Windows, Linux) or ⇧⌘P (Mac OS)) and select
Particle: Audit Environment. IMPORTANT: take care to sanitize this document and remove any sensitive information before submitting it along with your support request. - Navigate to the Particle Community's Workbench Topic (link) and create a support request via a forum post, taking care to further specify:
- Operating System
- CPU Architecture (32/64 bit? ARM?)
- What Particle hardware are you using (Argon, Boron, etc...) and with what Device OS Version?
- If you are experiencing an Intellisense issue, collect the following for your support request as well:
- With logging level set to “Debug”, select the “C/C++” entry in the Output panel’s drop-down menu (top-right next to the panel’s “close” button), open your
.ino/.cpp, and share the log it produces. - With your
.ino/.cppfile open, run theC/C++: Log Diagnosticscommand and collect the output. - Share the
C_Cppentries fromsettings.jsonin your project and user settings. - Create a minimal
.inoor.cppfile that reproduces your error (or if you are comfortable sharing, a link to a.zipfile of your entire project).
- With logging level set to “Debug”, select the “C/C++” entry in the Output panel’s drop-down menu (top-right next to the panel’s “close” button), open your
- Carefully, with screenshots as appropriate, walk us through the process with which you experience the error step-by-step, taking care to note expected behavior.
- Ensure you use the [ISSUE] Prefix in your Community Post so as to draw our attention to the post.