Monitor One getting started with Modbus
In this example, we will cover the basic setup for the Monitor One for getting measurements from a Modbus sensor. We will use a multi-weather station for measuring air quality but these instructions can be extended to any Modbus-RTU sensor.
- Monitor One or Monitor One Developer edition: NorAm, Europe
- I/O expansion card (included in Monitor One kit)
- 8-pin M12 cable (included in Monitor One kit)
- Micro-B USB cable
- 12V or 24V power supply (included in Monitor One kit)
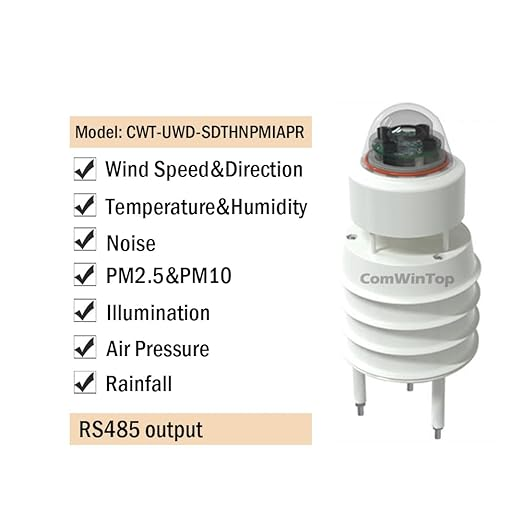
- UWD22-SDTHNPMIAPR 7-in-1 weather station
Reference docs
This tutorial series is based on the following docs:
Setup
First power
The Monitor One includes a 24V 1A power adapter and a barrel connector attached to the power lines in the 8-pin M12 cable as the standard power method. It is also possible to power the device using any power supply between 6V and 30V at 12 watts. The black wire is GND and the red wire is VIN. The internal power rails can safely handle transient voltage like the ones present on 12V and 24V vehicle power systems.
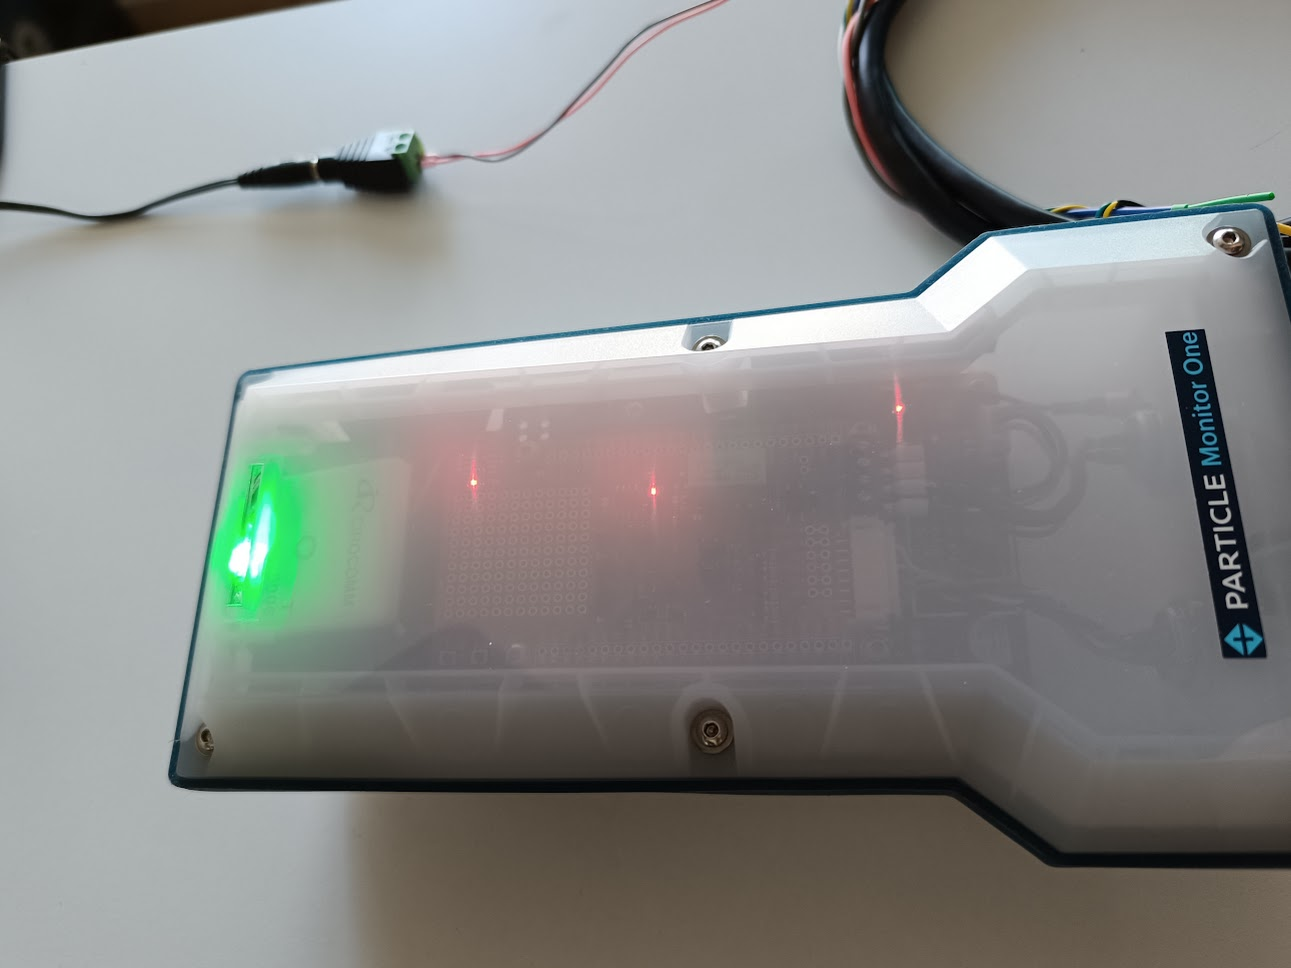
Monitor One comes from the factory in “shipping mode” to prevent the battery from completely discharging. When external power is applied, the status LED will start blinking green, meaning the device has booted and is looking for available cell networks.
Setting up the Monitor One
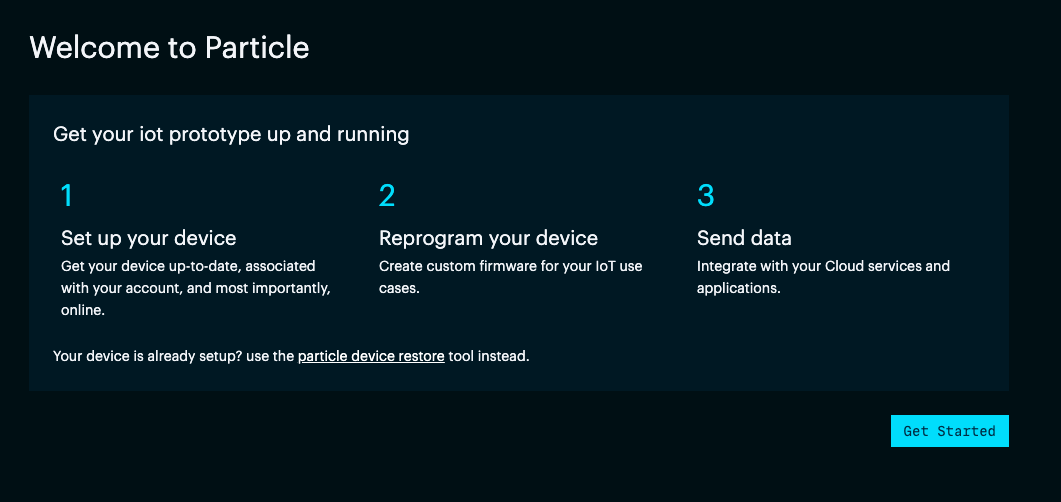
To set up the device and associate it with your Particle account, visit setup.particle.io. If you are not currently logged in, the page will ask you to do so.
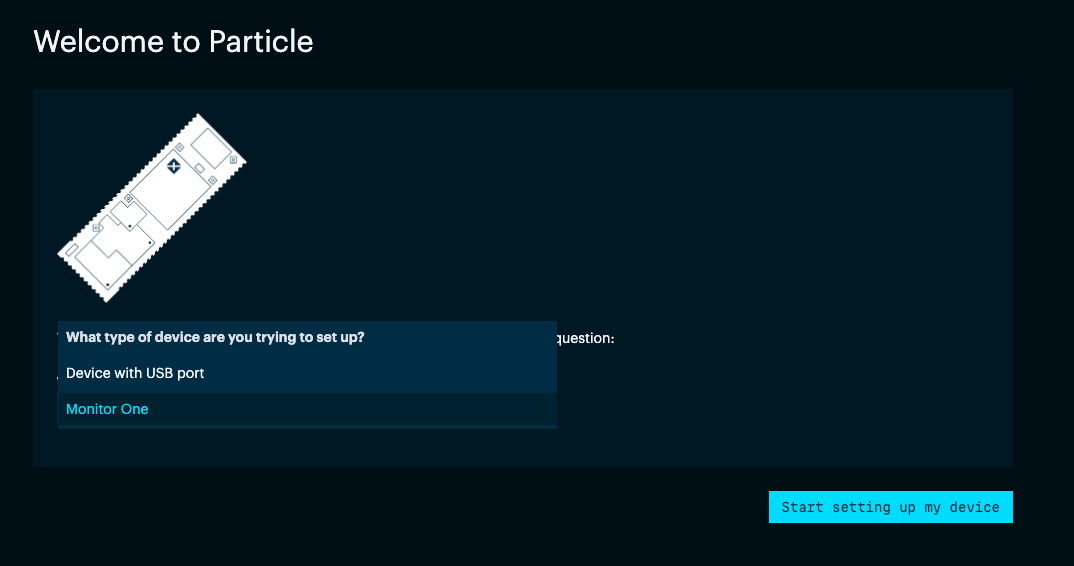
When asked, select Monitor One as the device to set up.
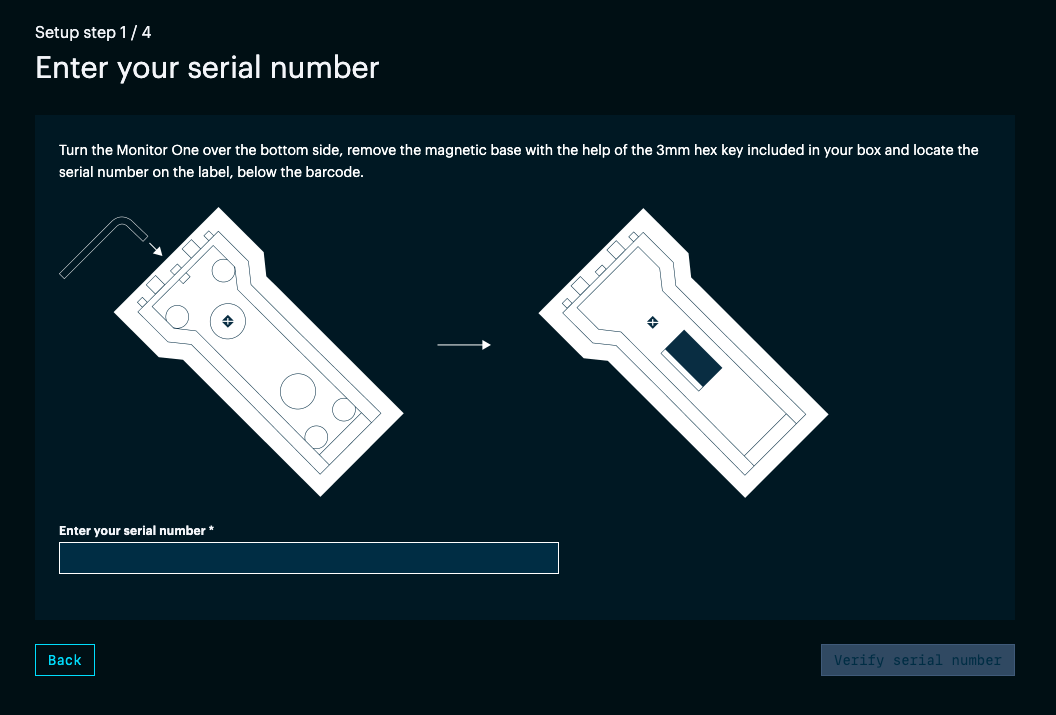
The page will ask for the serial number. This is located on the back of your device (removing the mounting backplate) and on the back side of the box.
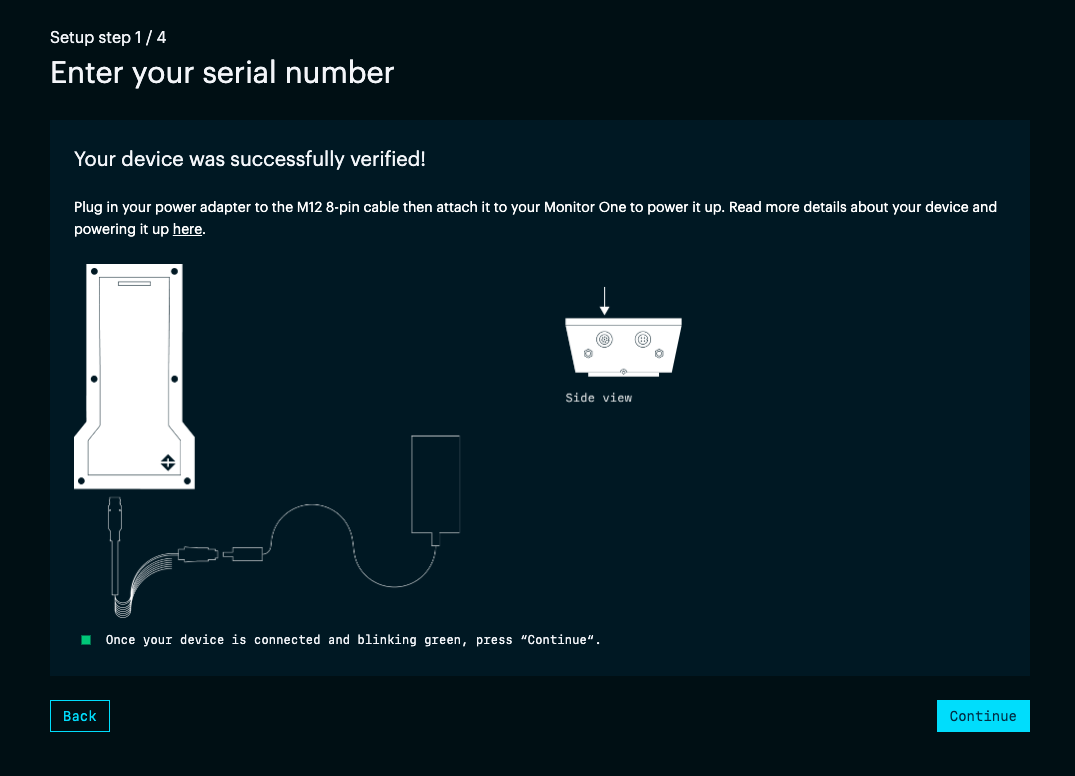
Once validated, the page will ask to power on the device and wait for the blinking green light.
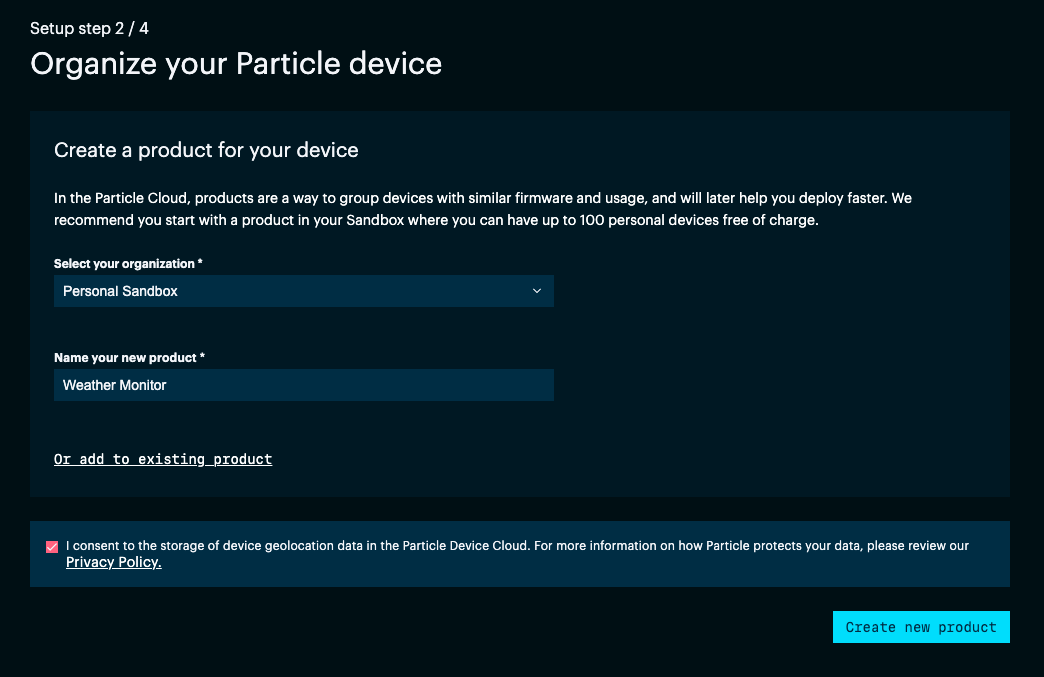
The Tracker family devices are required to be inside a product. You can select any existing tracker product in your sandbox or Org account, or create a new one. In our case, we will create a new one.
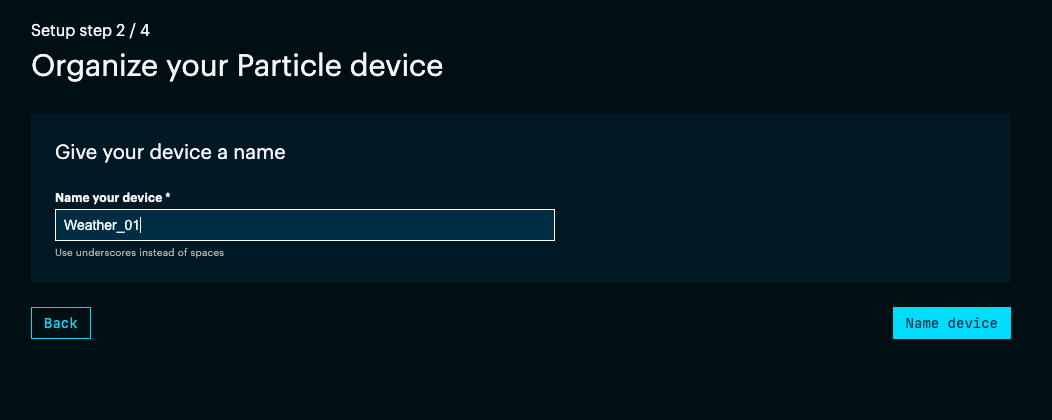
Next, name the device.
After that, the page will wait for the device to connect to the cloud. The RGB LED on the device should change from blinking green to breathing cyan. Meaning the device is successfully connected to the cloud.
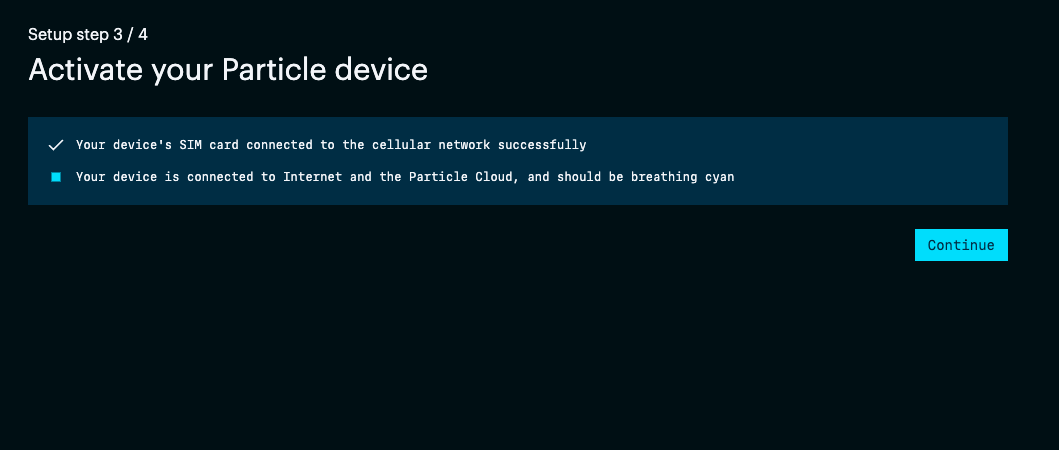
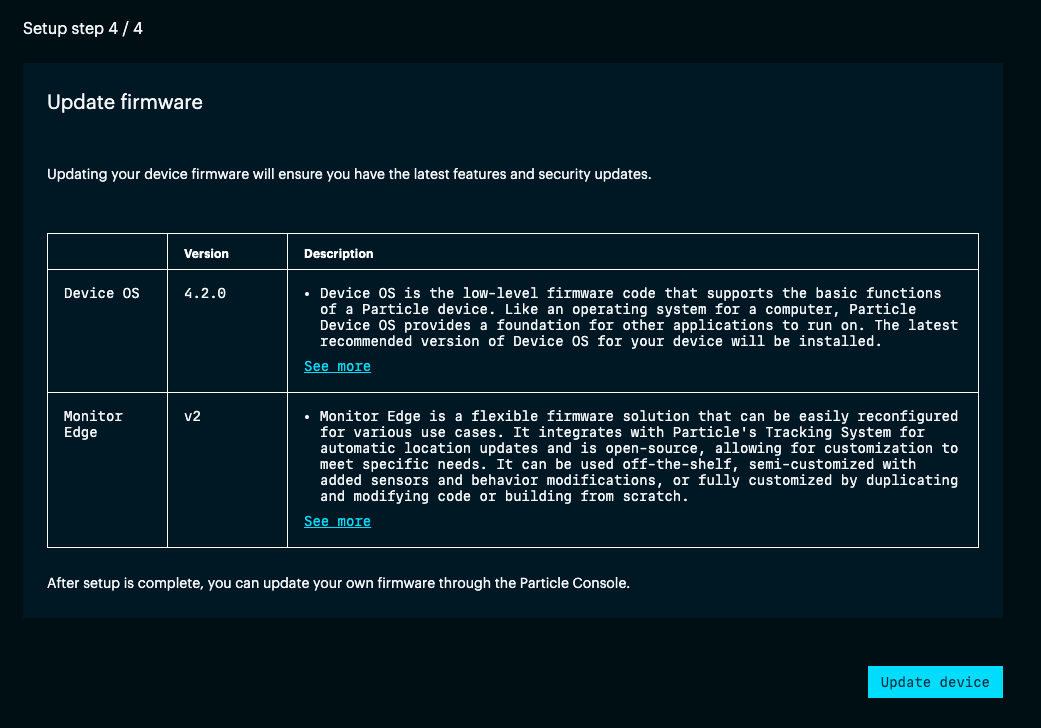
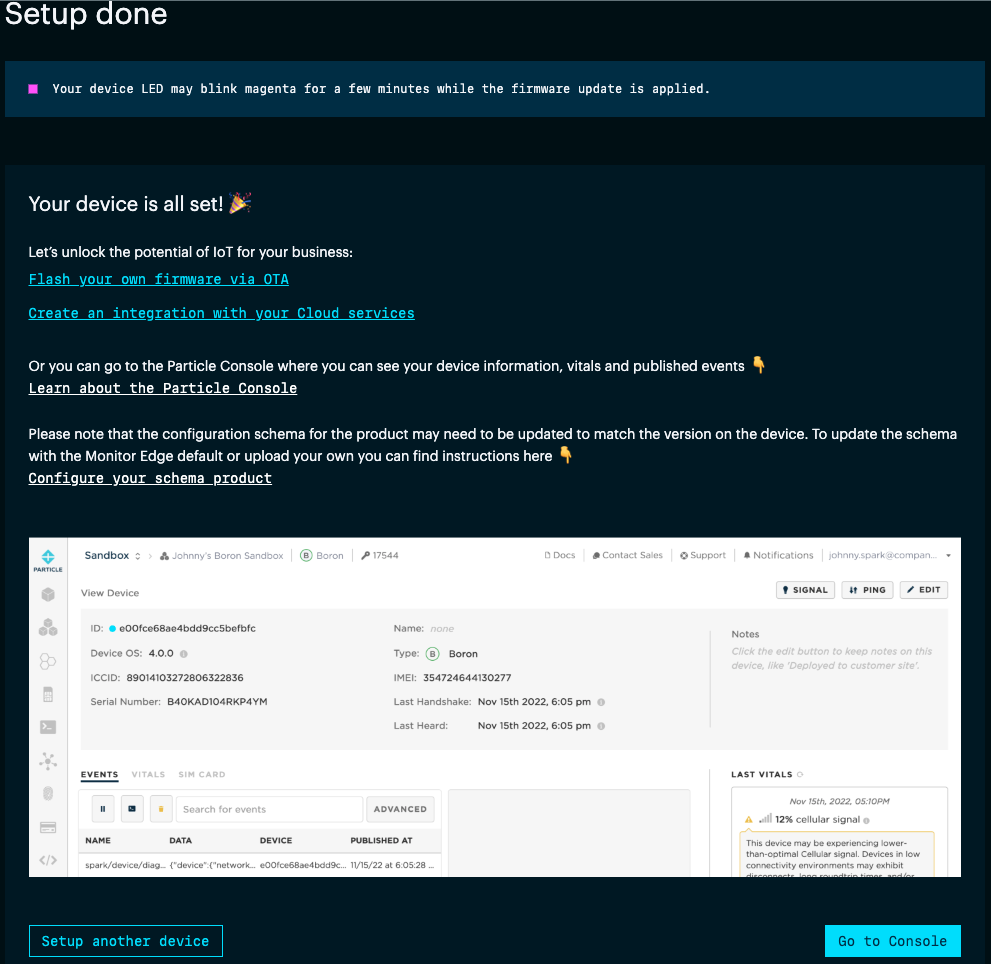
Finally, the page will update the device with the latest Monitor Edge firmware version. During the update process, the RGB light will change to magenta, white, blinking green, and lastly breathing cyan.
Once the device is updated, it is possible to go to the device page by clicking on the Go to Console button.
Console settings
Console Overview
Once redirected the device’s console page will be shown. At the page’s top, you will see the device's general info and 3 buttons:
- Signal. By clicking this, the device’s RGB LED will blink in different colors. Useful when we have lots of devices in the same place and we are looking for this particular device.
- Ping. Will tell the cloud to try to reach the device. If the device is online, ping will give back a success message. If the device is disconnected, unable to reach a network, or powered down, the cloud will respond with a failure message.
- Edit. This button allows you to edit the device name, add any custom notes, and fix a firmware version for this device if needed.
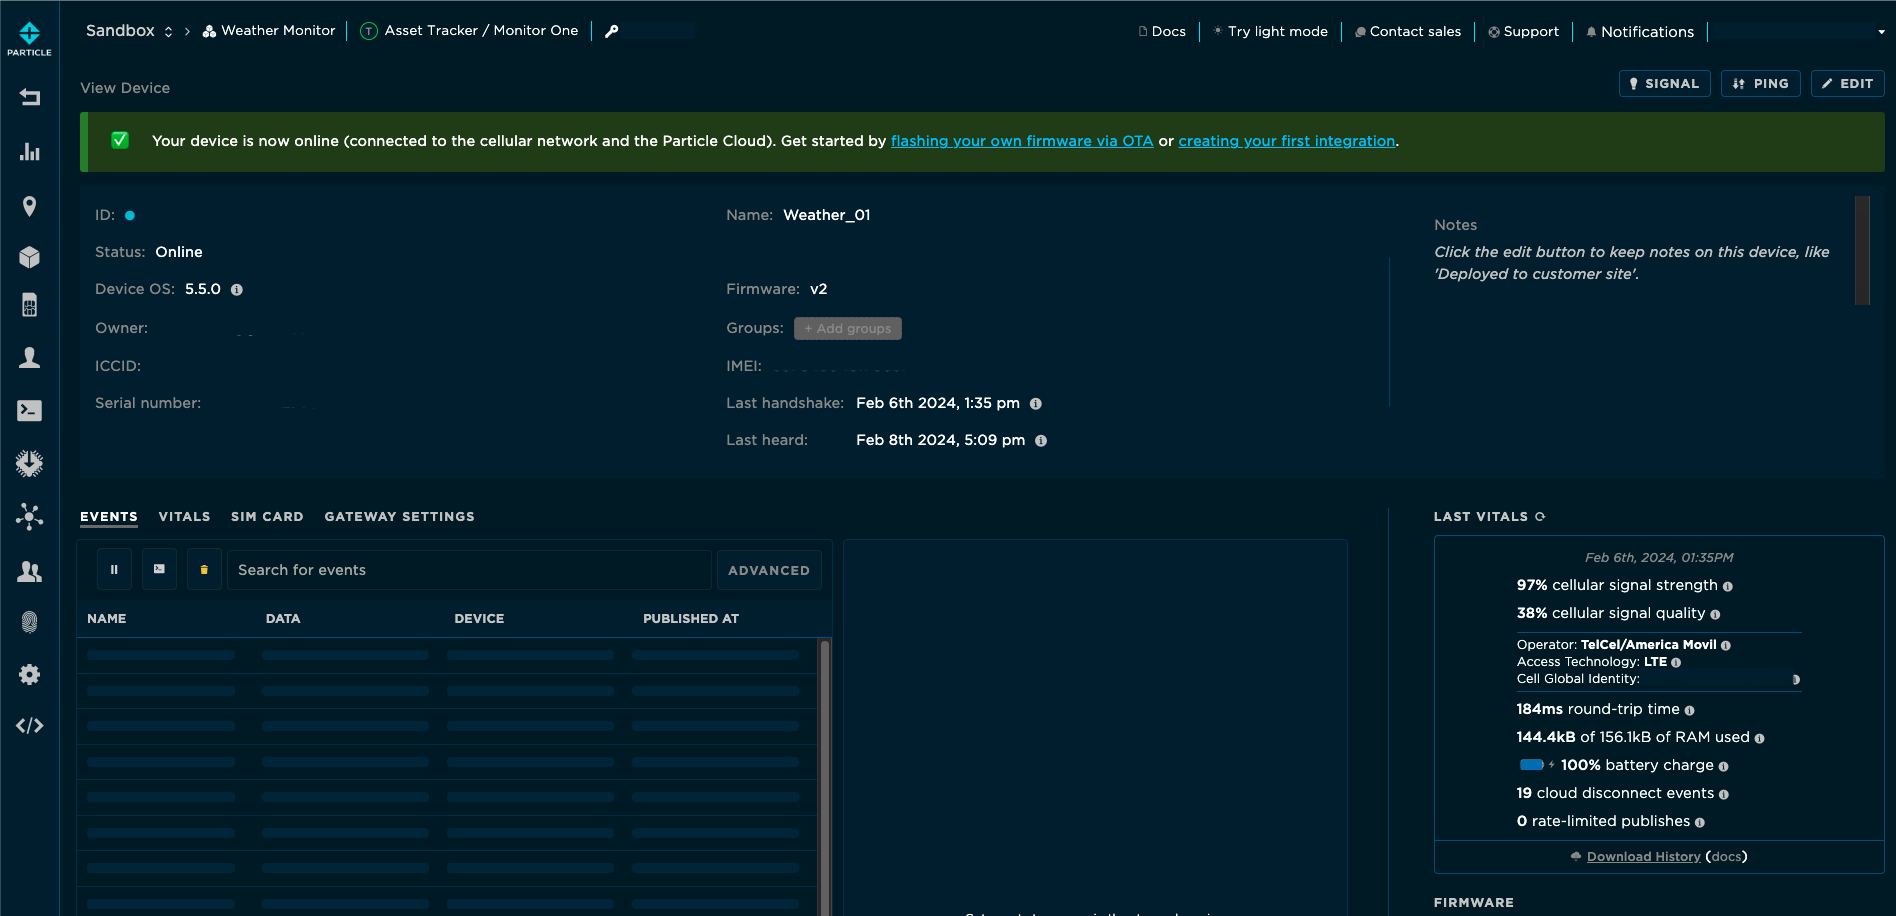
Below the general info, there are 4 tabs:
- Events: The events related to this device (including the location and custom publishes from the device) will be listed here.
- Vitals: Graphs of the last vitals data. Contains information such as the cellular signal quality/strength, round trip time, memory usage, and battery charge.
- Sim Card: This will show the data consumption during the current billing period.
- Gateway settings: These settings are the main configuration entries for our device. As these configurations are shared fleet-wide (all the devices in the same product), the config fields will be greyed. It’s not possible to modify them here unless the device is marked as a development device.
Map view
By clicking the Map icon on the left bar, the page will display all the devices on the same product along a map view.
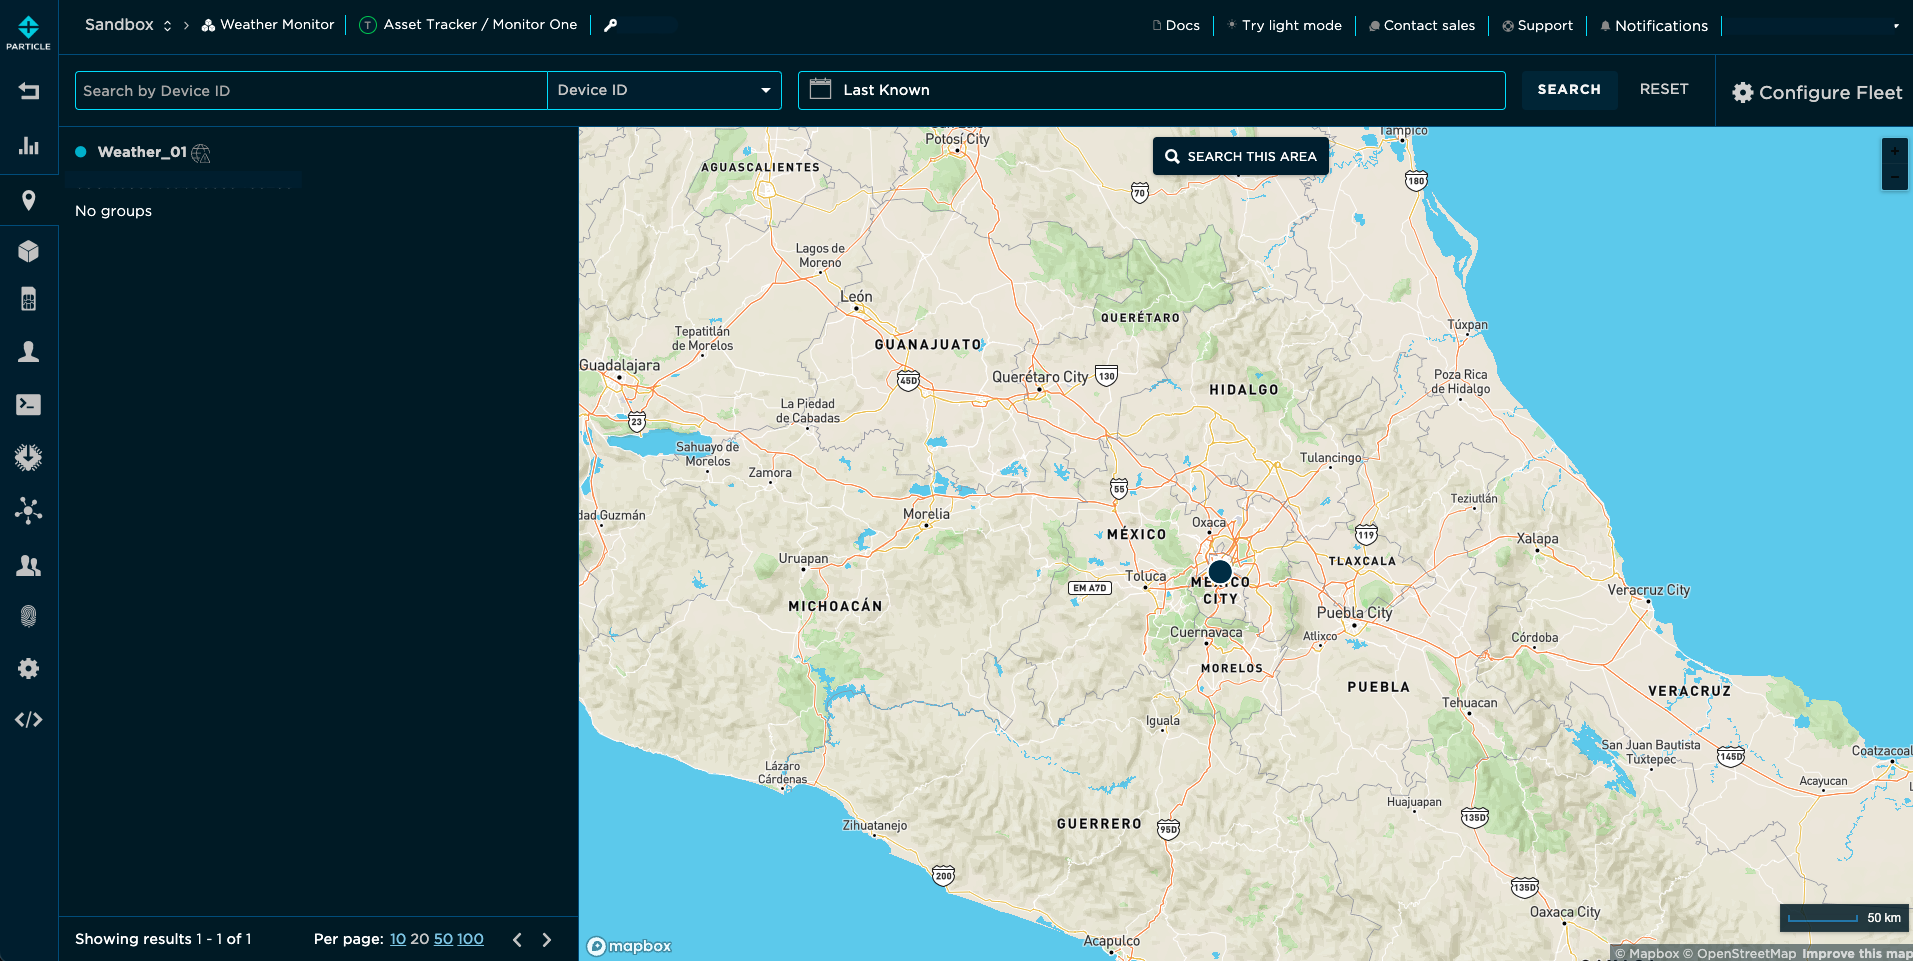
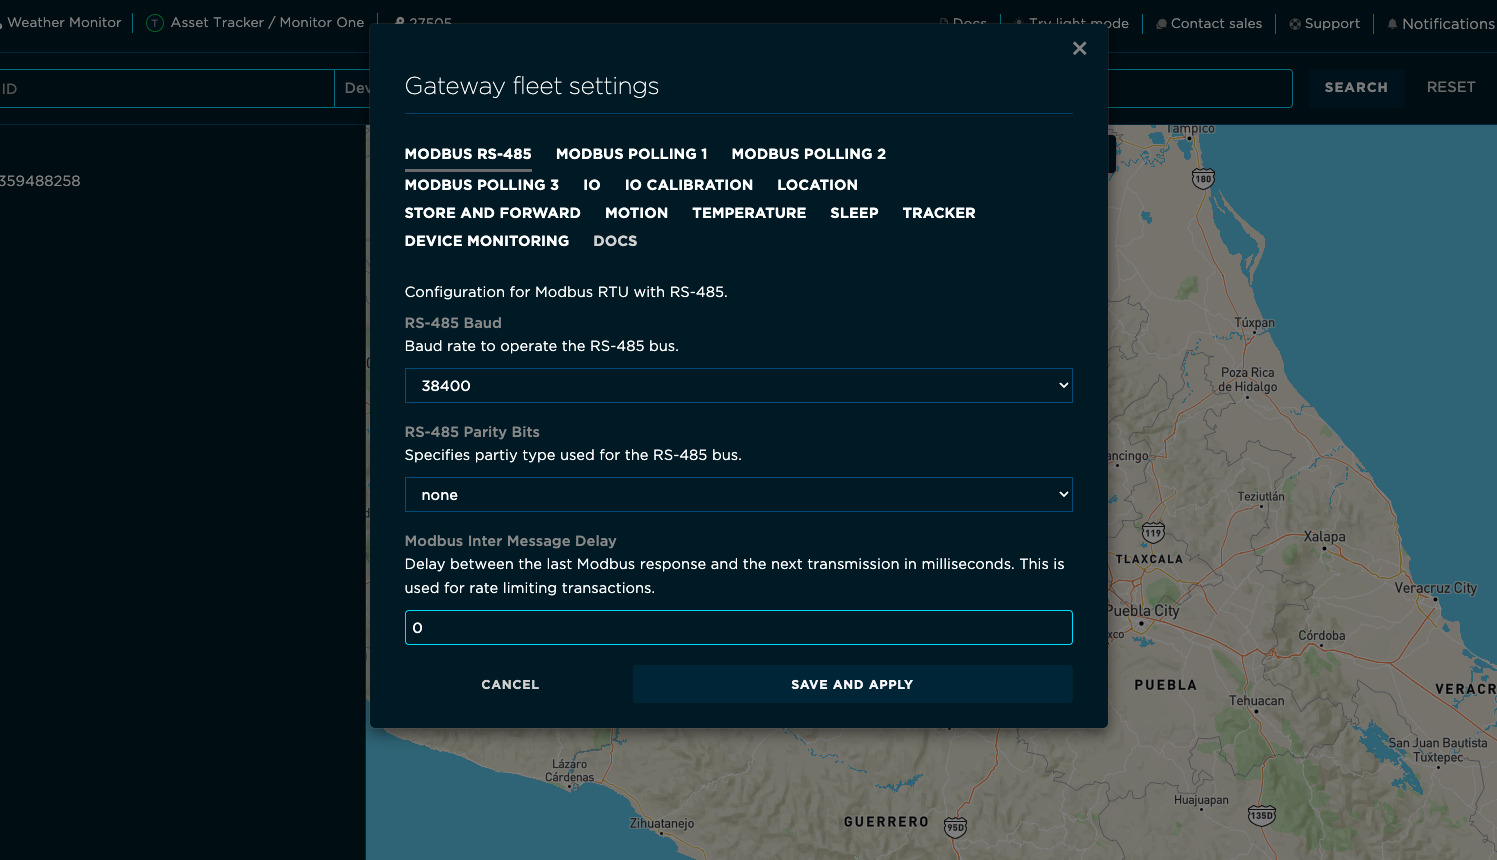
It is possible to change the fleet-wide configurations from here by clicking Configure fleet on the top right side of the page.
Note that any changes here will affect all your devices in the product, so it’s good practice to isolate any change to only a couple of development devices before deploying to the entire fleet.
Preparing for development
Going back to the device page, at the bottom left of the device page, under the Actions section, it is possible to mark this device as a development device. This will allow to modify configurations to this device only.
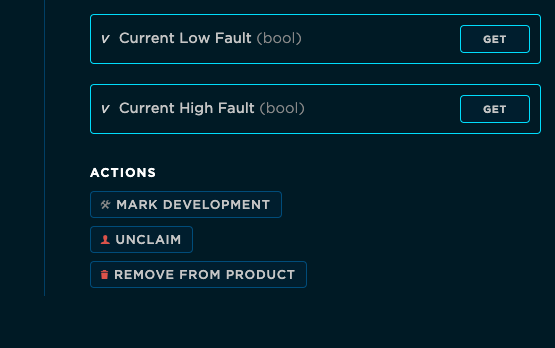
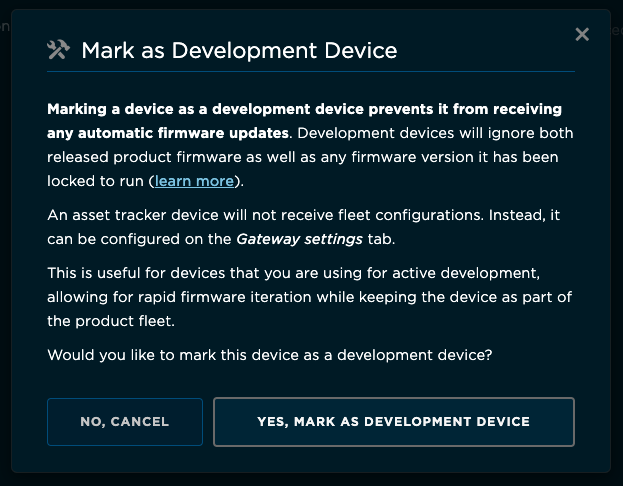
Once marked as development, a tools icon will appear next to the firmware version.

Attaching the sensor
It’s possible to use any Modbus RTU-compliant sensor out of the box, without the need for coding. For this example, we will use a UWD22 7 in 1 weather station to get PM2.5 and PM10 air quality measurements, but these instructions can be used for any other Modbus-RTU sensor.
Power requirements
From the specs, we see the sensor is compatible with a wide range of input voltage:

Since we are using a 24V power supply for the Monitor One, we can use it for the sensor too.
Modbus settings
Is important to note that Modbus-RTU is a protocol built on top of UART (serial) and RS485.
- RS485 is a physical layer specification to allow two or more devices to use serial up to 500 meters, through a differential pair wire system.
- On top of the physical layer, the commonly used UART data link layer is specified for Modbus. We need to know the baud rate, parity, data bits, and stop bits used by the sensor.
- Modbus-RTU defines the communication protocol to be used over serial. Is considered an application layer protocol.
Modbus RTU is a client-server protocol. The server (Monitor One) always initiates the conversation. The clients (sensors, relays, etc.) each have a unique address assigned so you can have multiple clients on a single Modbus RTU interface. You may see the server referred to as the master and the client referred to as the slave in some cases.
Although the datasheet states is possible to change the device baud rate and address, we will stick to the default values.
The server request also contains a function code that indicates if the operation will be a write or a read, a register address where the operation will be applied, a data field, and a CRC field. All of this is managed by the Monitor Edge firmware. We just need to know the register address and the size of the data we will read.
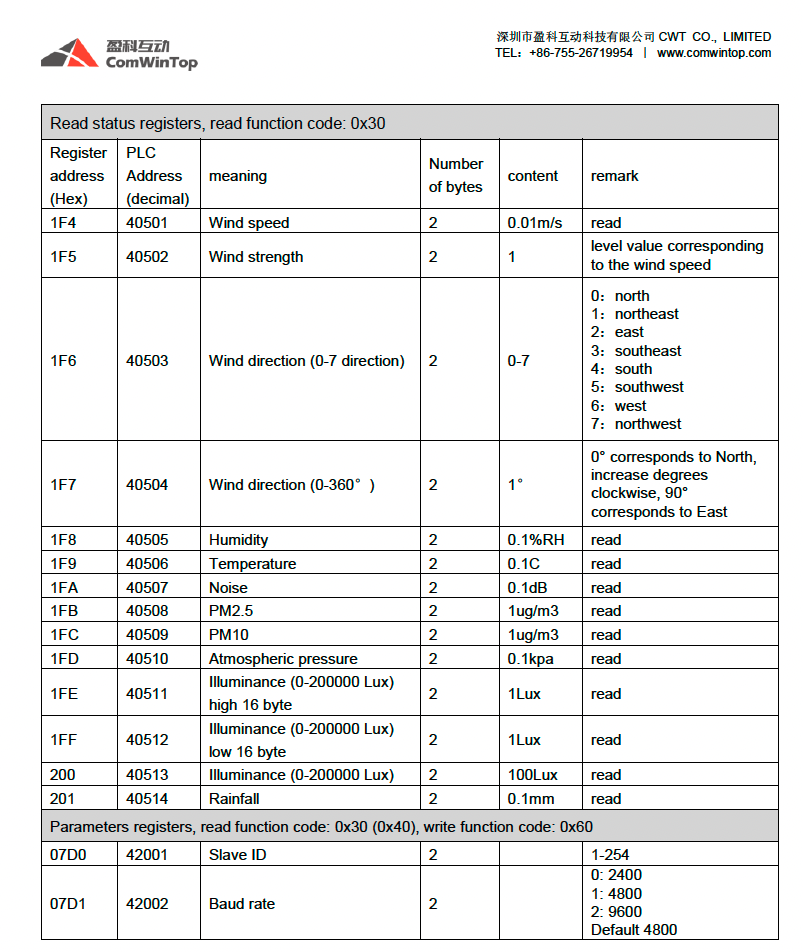
As we want to get the PM2.5 and PM10 values, we need to look for the corresponding registers, the byte numbers to read, and the scaling used on the data.
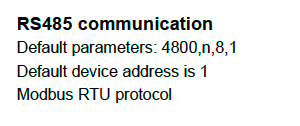
To access the device we will use the following bus parameters:
UART
- Baud rate: 4800
- Parity bit: None
- Data bits: 8
- Stop bits: 1
Modbus
- Device address: 0x01
- PM2.5 read address: 0x1FB. This value is two bytes and represents 1 ug/m3 for each LSB
- PM10 read address: 0x1FC. This value is two bytes and represents 1 ug/m3 for each LSB
Pinout and wiring
The sensor wiring is very simple. Two wires for power and two wires for RS485.
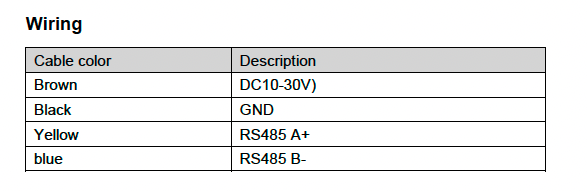
When using the Modbus protocol, we will use RS485 nomenclature for the pinouts. In this case, A+ and B- are the names for the RS485 half-duplex bus lines.
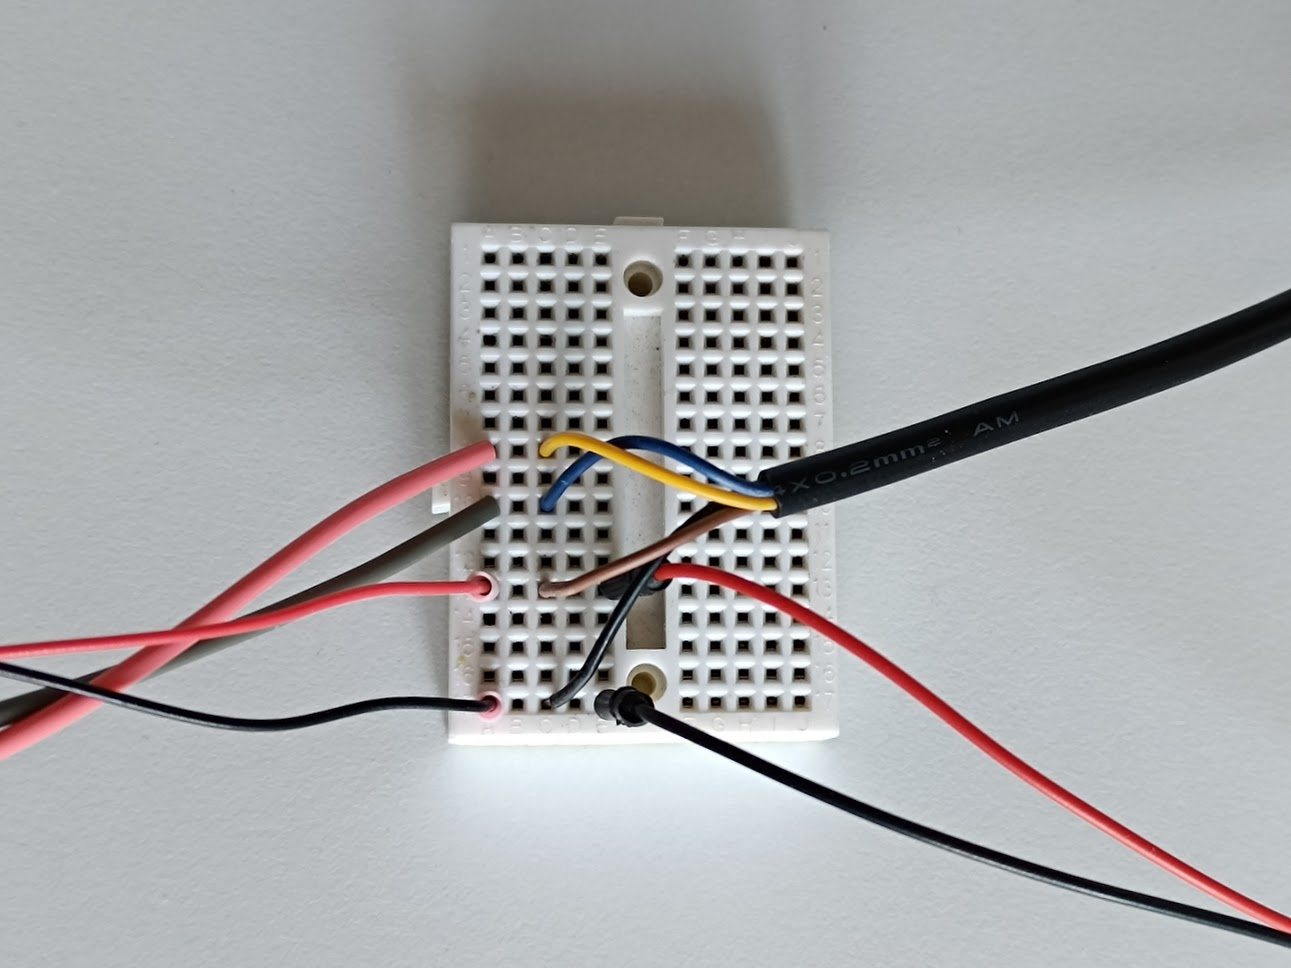
On the Monitor One side, we just need to locate the same cable colors and join them.
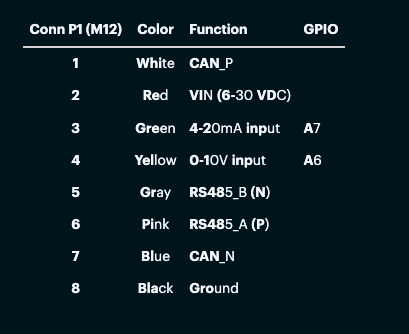
The wiring schema is:
| Monitor One | Sensor | Barrel Jack |
|---|---|---|
| VIN (Red) | DC IN (Brown) | + (Red) |
| GND (Black) | GND (Black) | - (Black) |
| RS485_B (Gray) | RS485 B- (Blue) | |
| RS485_A (Pink) | RS485 A+ (Yellow) |
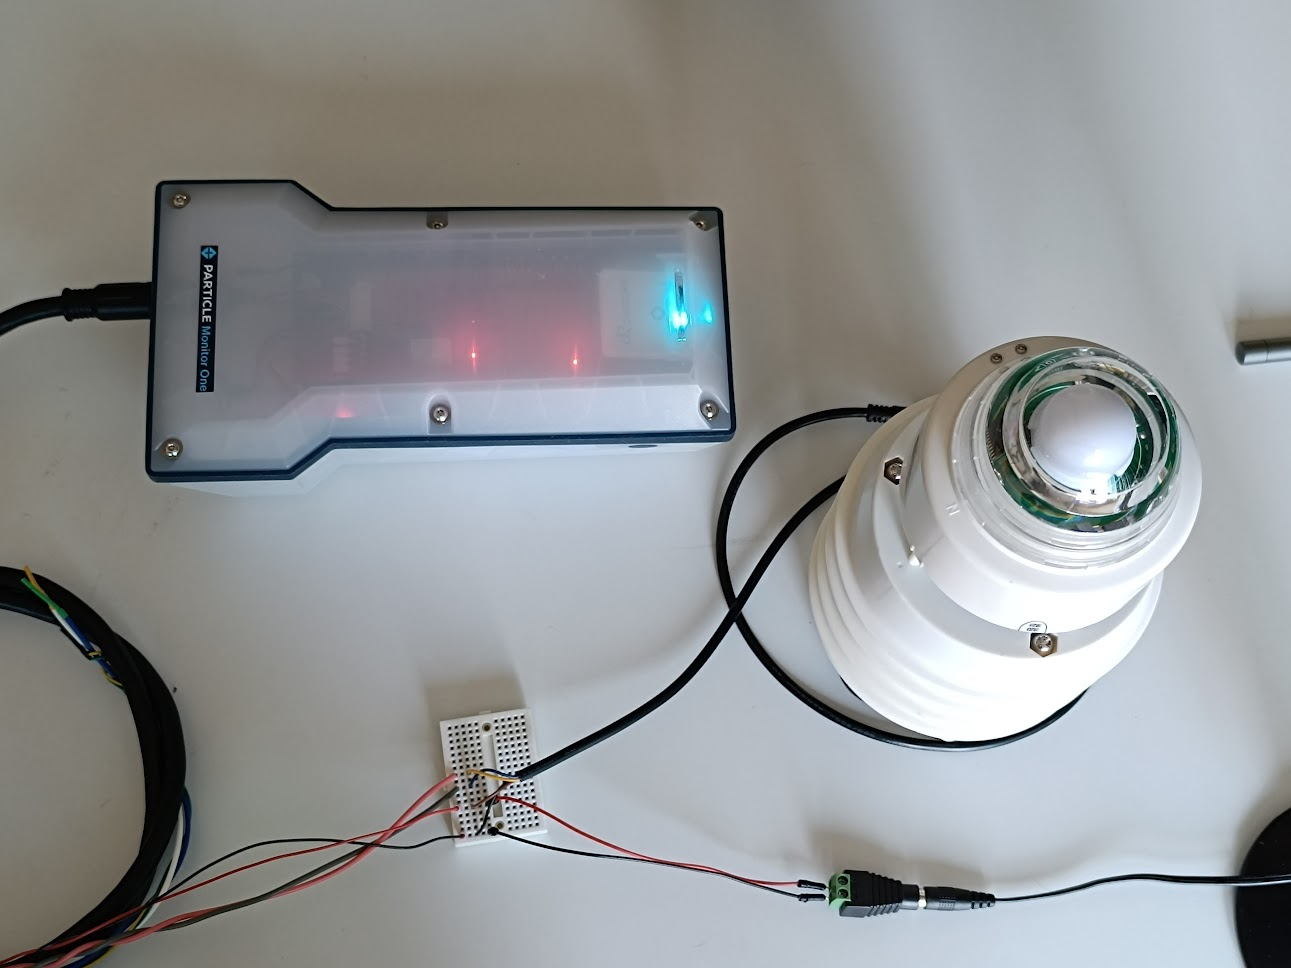
Device configuration
Once everything is wired, powered, and non-smoking, we can take a look at the device configurations.
Location Settings
Before entering the sensor-related configurations, we will take time to explore the main publish event on Monitor One: Location.
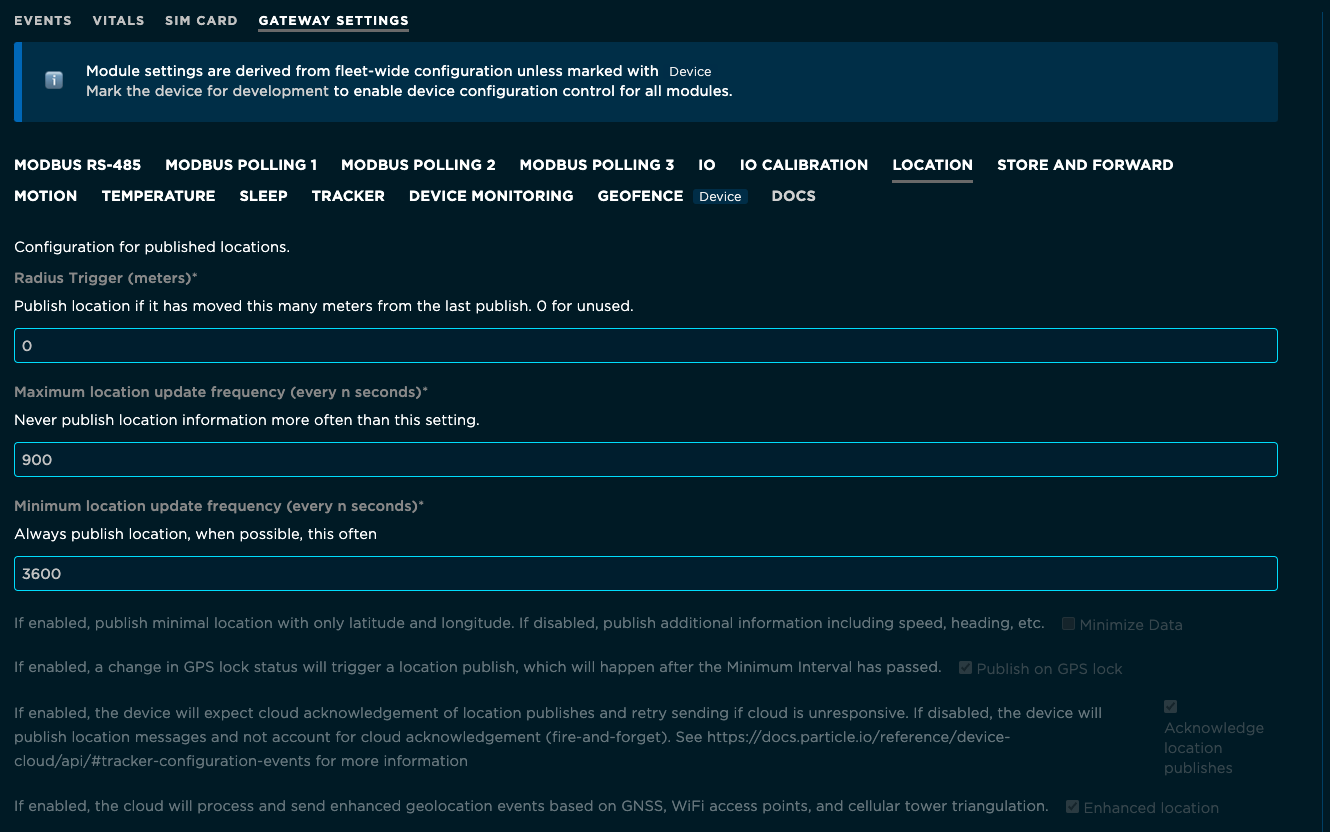
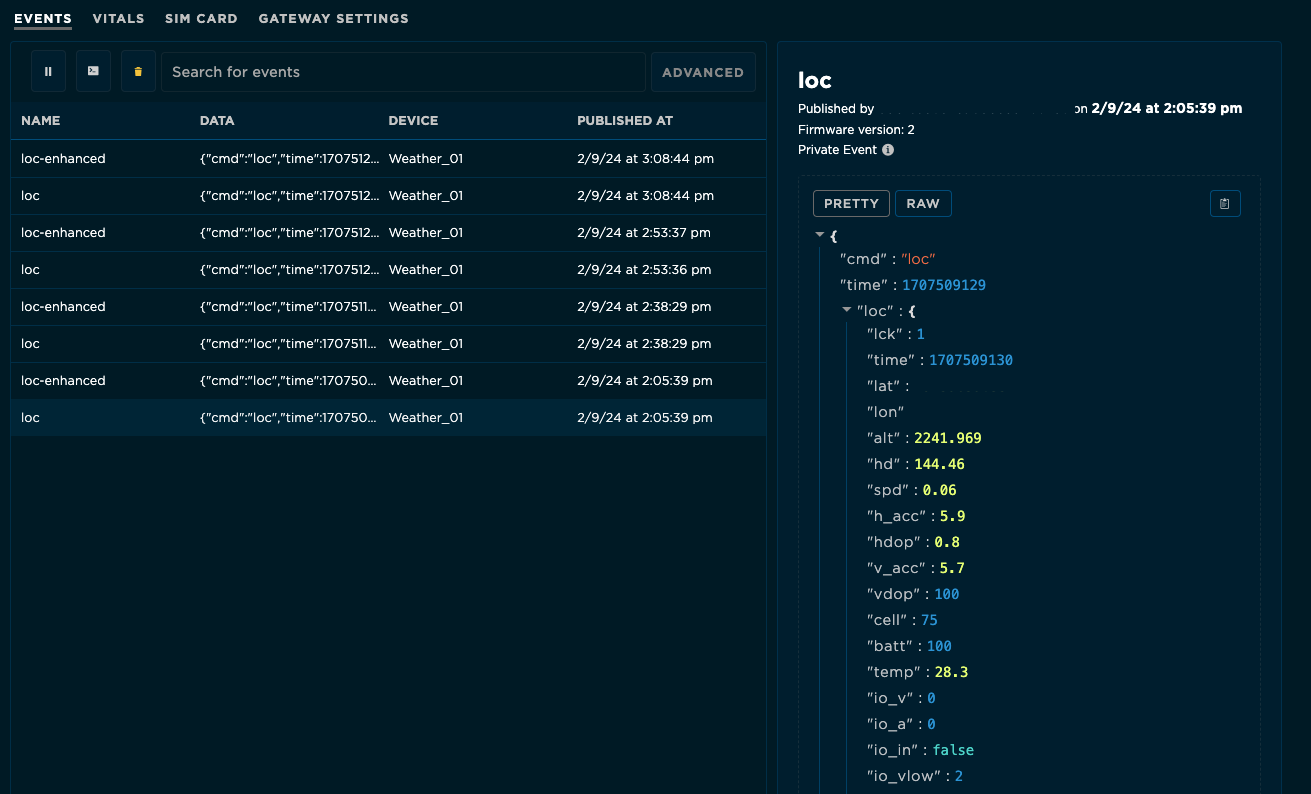
By default, the Monitor Edge is configured to publish a location event every 900 s (15 min). If you leave the events tab open long enough, the device-published loc events will be listed.
You can change the behavior of the loc publishes by looking at the Gateway settings location tab:
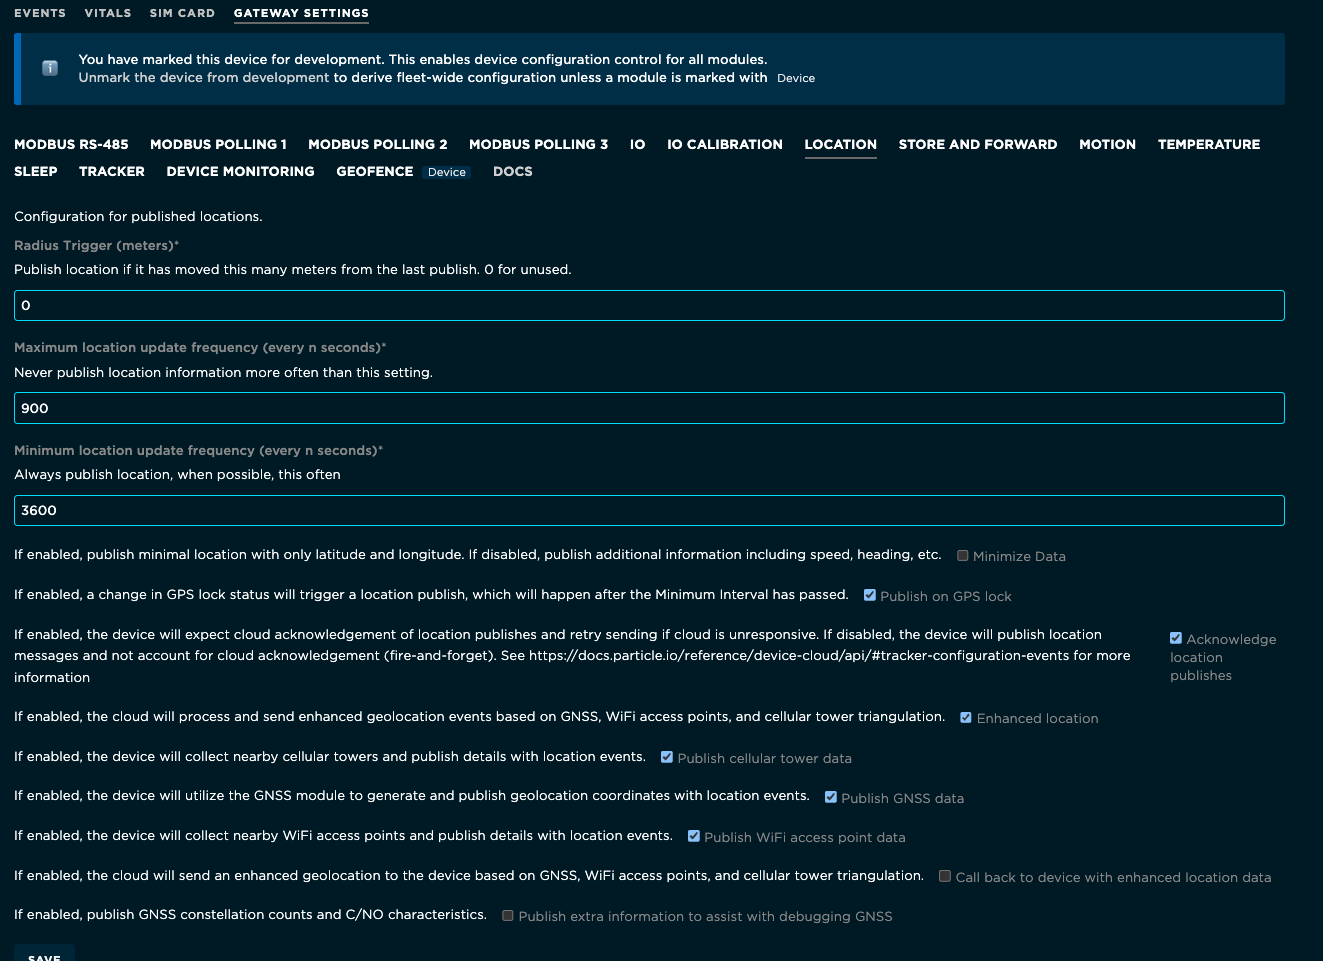
The location publish can be triggered by many events, being the time the main triggering source.
In the example, the device will publish at least every 60 minutes (3600 s). Any other trigger source can shorten this interval but it will be limited to a maximum of 1 publish every 15 min (900 s).
The enhanced location options will enable the device to send along data from nearby cell towers and wifi access points, allowing the cloud to get a better location fix based on this data. It is possible to select the data to be published, and if the cloud can call back the device to give the processed data to the device.
By clicking the Save button, the cloud will send the configurations to the device to be applied.
Here is a document with the full explanations for the configuration options.
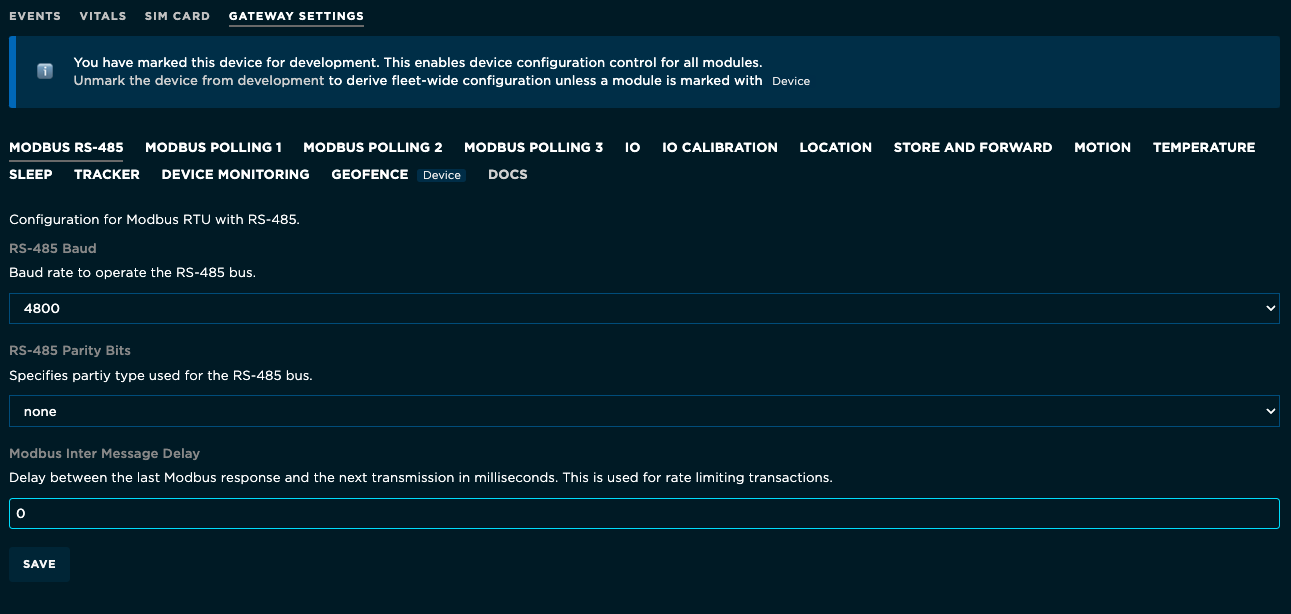
RS485
The RS-485 UART is enabled by default, you only need to put the right baud rate and parity bits (from the sensor’s datasheet) and click save.
Modbus settings
By default, the device allows the configuration of up to 3 Modbus read modules. This allows to read different registers from one or more devices. Each of those is configured in their respective “Modbus polling” tab.
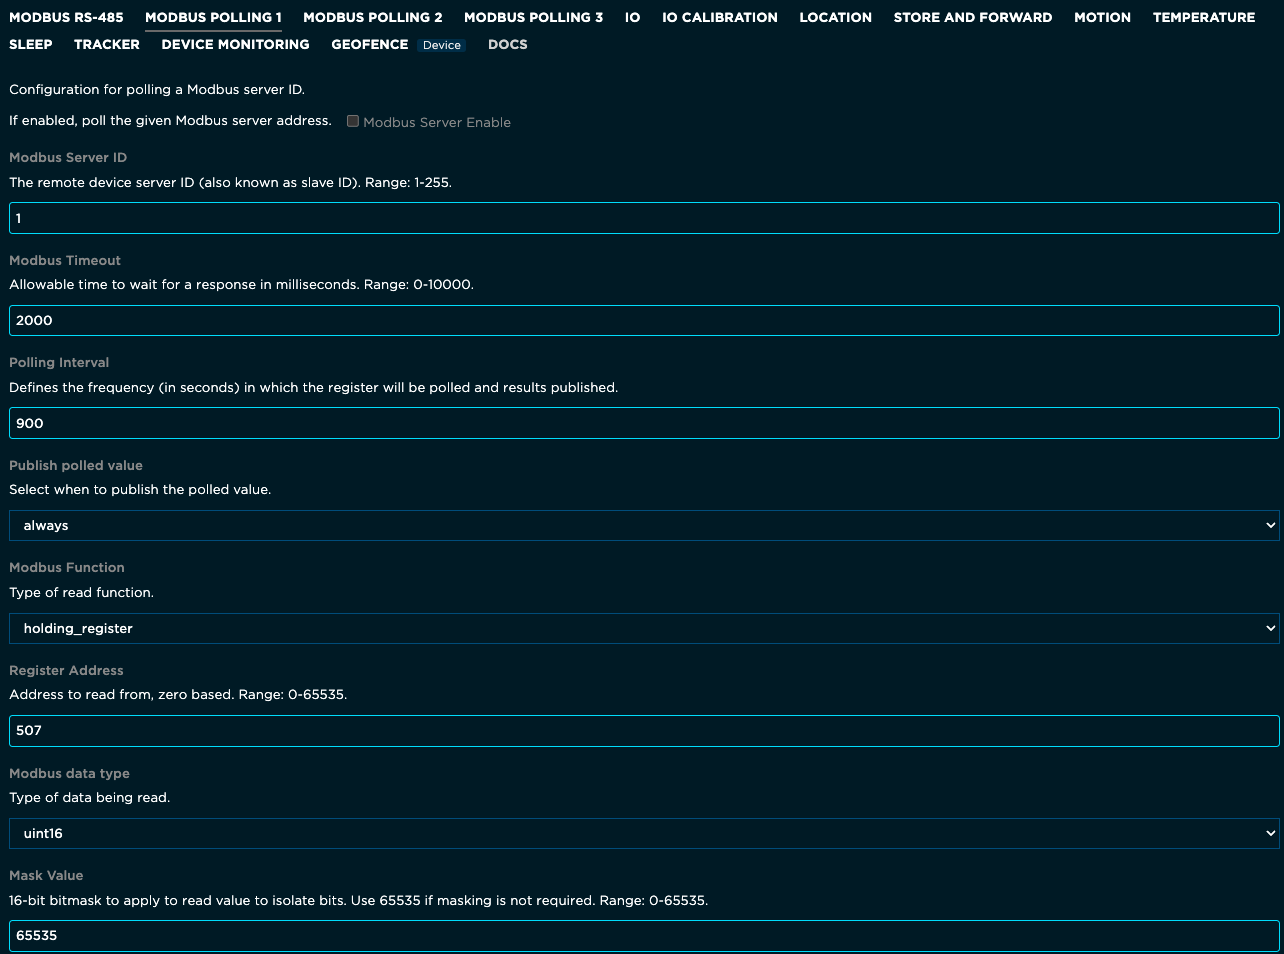
To configure the PM2.5 readings in the Modbus Polling 1 tab, the next settings will be used:
- Modbus server enable: By checking this box, this tab’s configurations will be active.
- Modbus server ID: The Modbus address of the client device, in decimal. In our case,
1. - Modbus timeout: The allowable time to wait for a response from a device, in seconds.
2is a good starting point. - Polling interval: The rate at which the device will be read and the Modbus will publish to the cloud, in seconds. In our case, every 15 minutes (
900) is a good starting point for deployment. For testing, is better to use something faster, like60. - Publish polled value: Currently, the only option available is
always. - Modbus function: This will specify the type of register to use. The coil is for reading a bit value, discrete_input is for writing a bit, input_register is for writing byte(s), and holding register is for reading byte(s). In the case of reading data from sensors, the
holding registeroption must be used. - Register address: This value must be in decimal. As the PM2.5 is read in the holding register address 0x1FB, the value
507is used. - Modbus data type: This specifies the FW how many bytes must be read starting on the register address, and how to interpret the binary data stored in. In our case,
uint_16is used as the sensor datasheet specifies the values are 2 bytes, unsigned. - Mask value: It’s possible to mask out bits from the read data using a 0 in the place of the bit we want to mask out. In our case we won’t need to mask any bits, so
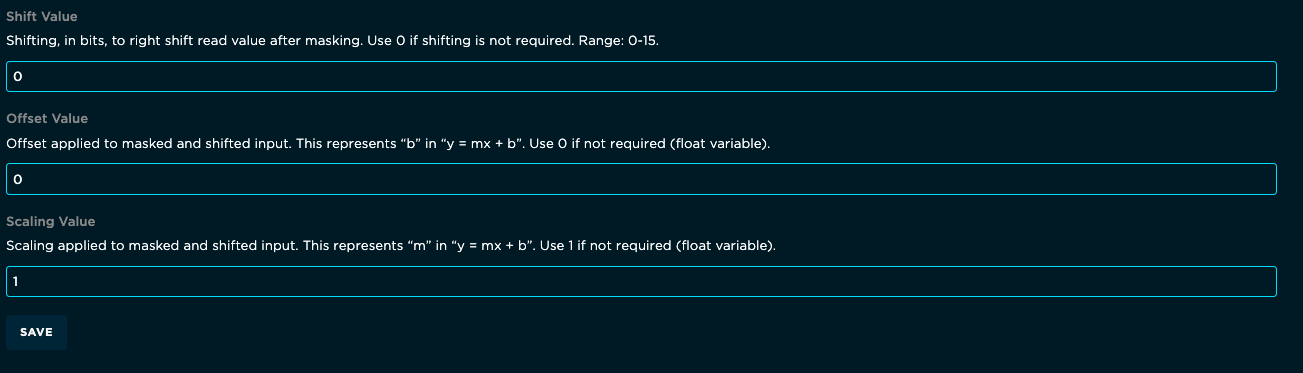
65535(0XFFFF) is used. - Shift value: It’s possible to shift right the bits received. We won’t need to do this, so
0is used. - Offset value: Is possible to pre-process the data read by adjusting an offset up or down. In our case, we don’t need to adjust the offset,
0is used. - Scaling value: Is possible to use a gain or scale up the read value. In our case, we don’t need to scale it.
As the PM10 measurement has the same format and scaling, the same configurations are used on the Modbus Polling 2 tab, just changing the Register Address to 508.
By clicking SAVE, the options will be sent to the device.
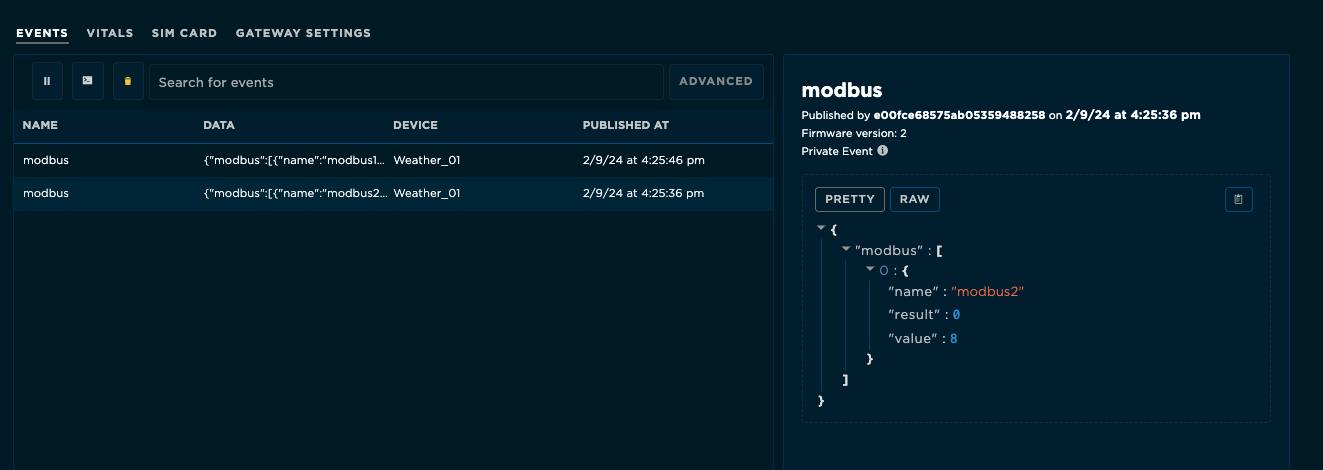
By going back to the EVENTS tab and waiting for the specified time amount, we will see the modbus event being published.
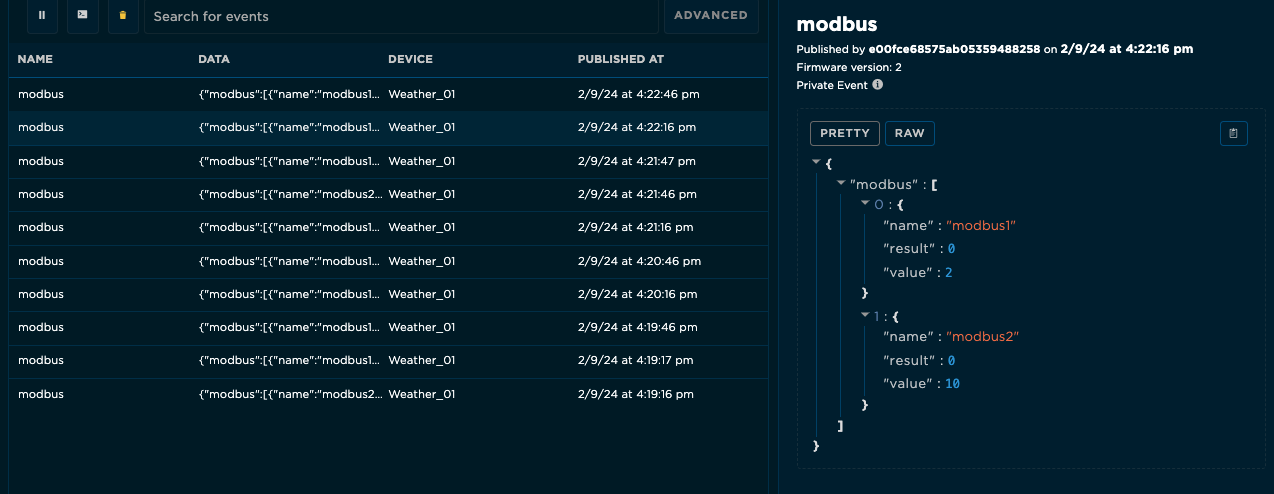
The resulting data is published in JSON format:
- The
namefield indicates the source of the published data. - The
resultfield is 0 when the reading from the sensor succeeds and -226 when the reading from the sensor fails, as stated on the Modbus specification. - The
valuefield contains the processed result. In this example, 2 ug/m3 for PM2.5 and 10 ug/m3 for PM10.
Is worth noting the data from the two readings will be merged into a single payload if both measurements are made at the same time. When the measurements are not in sync or some measurement times out, the results will be published on different events.