
Troubleshooting Webhook/Integration Issues
If your Particle-based Integration endpoint is failing to receive data, or is throwing unexpected errors, this article is a great starting point for your troubleshooting investigation. It's also worth exploring our Webhooks Tutorial (link) and our API documentation (link) before proceeding to troubleshoot.
Navigating to the integrations page
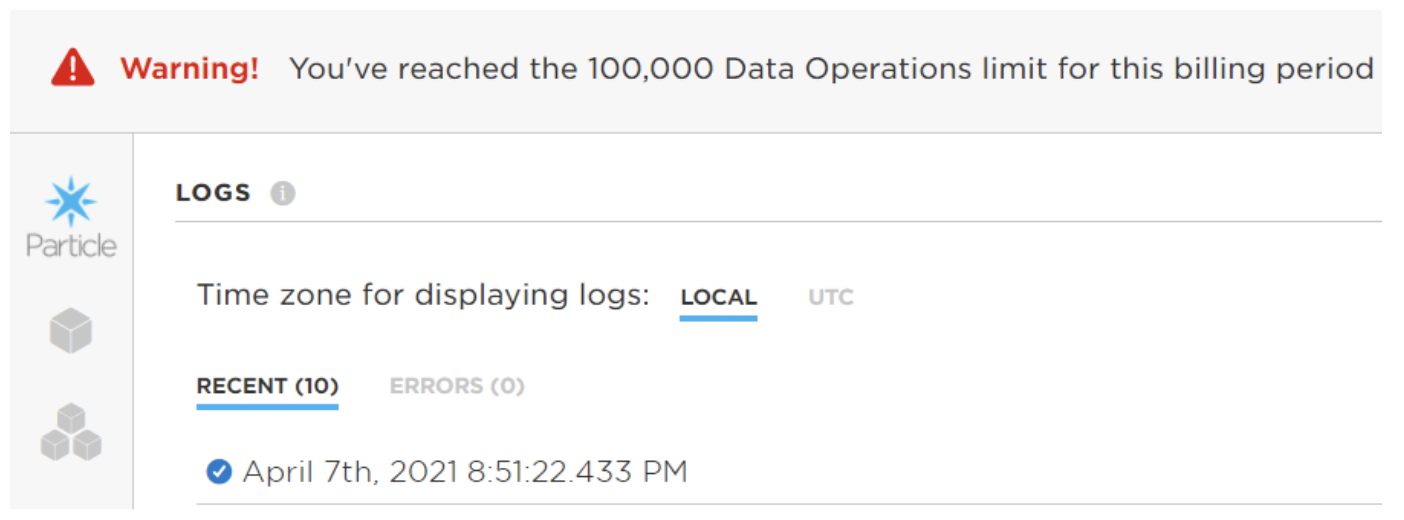
Particle thoroughly logs the request and response of the last 10 Webhook successes and errors. This information is available to you in the Integrations panel of your Console, by selecting the following icon from the left-hand panel:
Please be aware that Integrations contained within a Product are only visible once you've selected that Product's page within the Console.
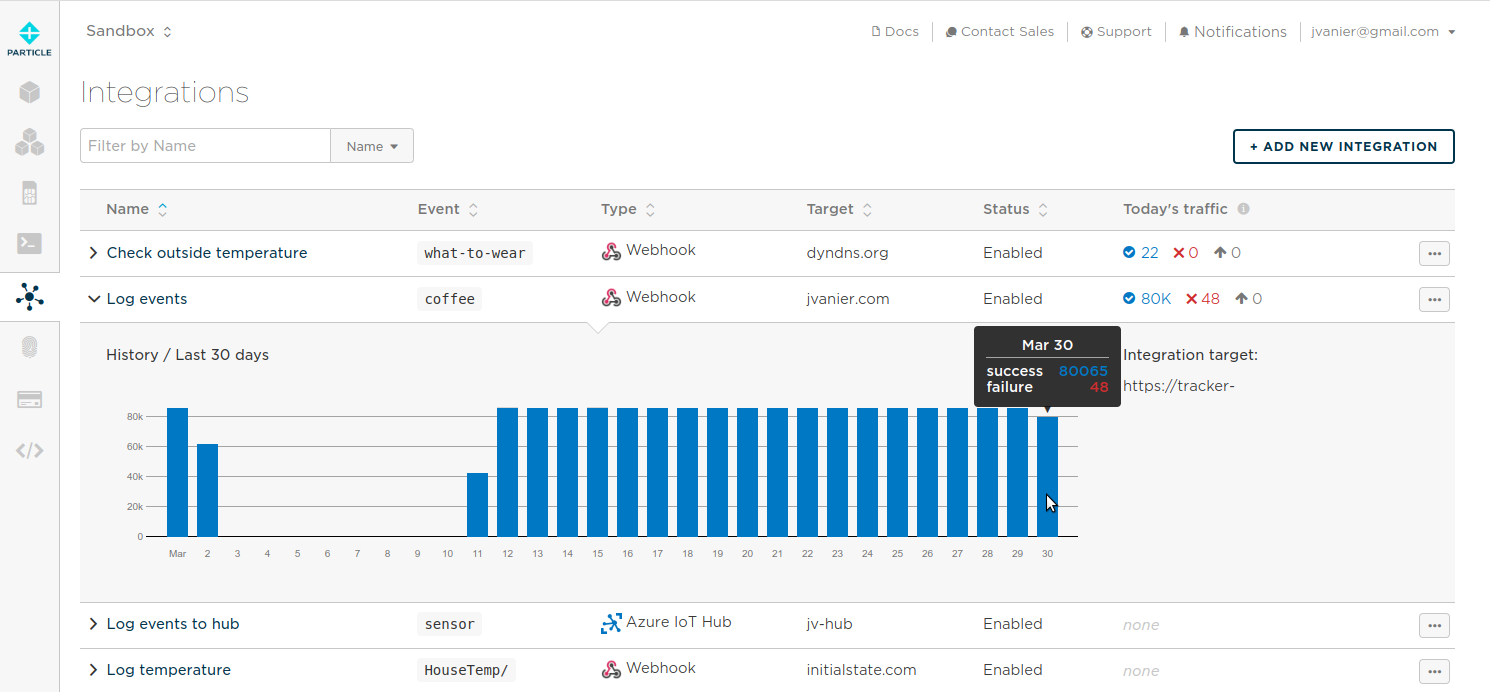
Find the integration that is having issues by looking at the number of failures in Today's traffic. You can also expand the row to view the history over the last 30 days.
After selecting a given Integration, the contents of this panel are likely familiar to you: a section on Integration Info, Example Device Firmware, and then - most relevant to our concerns here - the History section. Scroll down to History and take a note of the graph. A healthy state might look something like this:
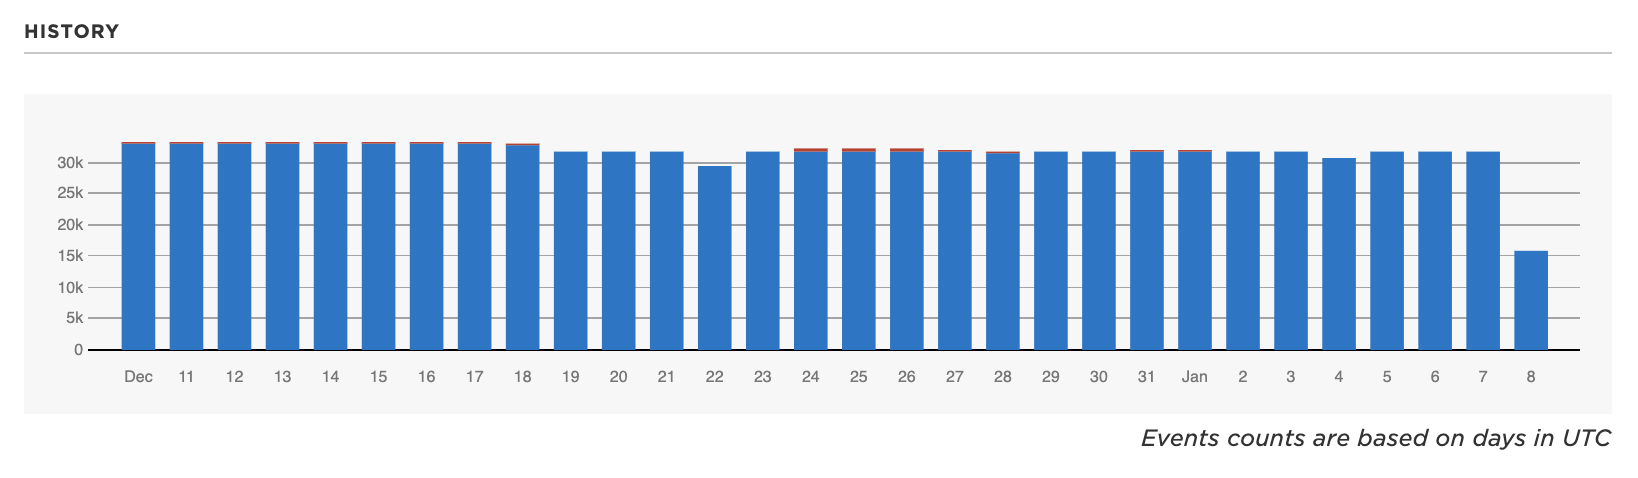 A drop-off on the last day of this graph is expected, as it displays Integrations that have fired successfully today. Integrations that received a success response from their end destination will appear hear as blue. Integrations that received errors will appear here as red. Integrations that have been skipped after too many successive failures to a given endpoint will appear here as gray. Given that you're reading documentation on diagnosing a Webhook/Integration issue, it's likely you're seeing a combination of two or more of those colors.
Scroll down further to the Logs section immediately below the History graph. Here you will see the last 10 Successes and the last 10 Errors with thorough logging. These are broken out in the following way:
- The Event
- The Webhook Request - the HTTP request triggered by an Event within the Particle ecosystem that has in turn been formatted by the parameters with which you created your Integration and sent to the Webhook URL (AKA your destination endpoint, e.g. your website's server).
- The Webhook Response - the HTTP response received by Particle's Webhook infrastructure from your destination server.
This is most often the right place to look for error codes.
A brief note on Success - Particle identifies asuccessful message based on standard 2xx responses from your endpoint. Particle expects:
- Code 200 (if you want to send information back with the request)
- Code 204 (if you do not need to send any further information apart from a success confirmation)
The Errors page will prepend another important piece of information at the top of this series of logs:
- The Error Message - oftentimes this will be contained within the Webhook response, but in some circumstances will not.
Now that you are familiar with the general layout of this page, let's dive deeper into the various error states one can encounter.
Missing integrations
Let's say your Integrations History graph is emptier than you'd expect. This typically points to an issue downstream, where something is blocking the passage of expected Events from your device to our Integrations infrastructure. This is most often one of four things:
- Check that the device is claimed to the actual Product Owner. This will minimize setup inconsistency and ensure all Events are published.
- Your devices are offline or not Publishing Events as expected. The easiest way to check this would be to simply set up an Events Stream for the target event, replacing the access token with a valid access token, such as from
particle token create.
or by following the instructions here (link). Ensure that a test device with guaranteed connectivity is able to Publish to this Event successfully and then watch for the rest of your expected devices.$ curl "https://api.particle.io/v1/events/:EVENTNAME" -H "Authorization: Bearer f8a4d380cb6ffffffffffffffffffaf5e496ddf0c0" - Double-check against your devices' Events Stream in the Console - this is accessible to you either across your User- or Product-scope via the left-hand toolbar:
or by selecting a specific Device from the Devices page and viewing the Event Stream monitor: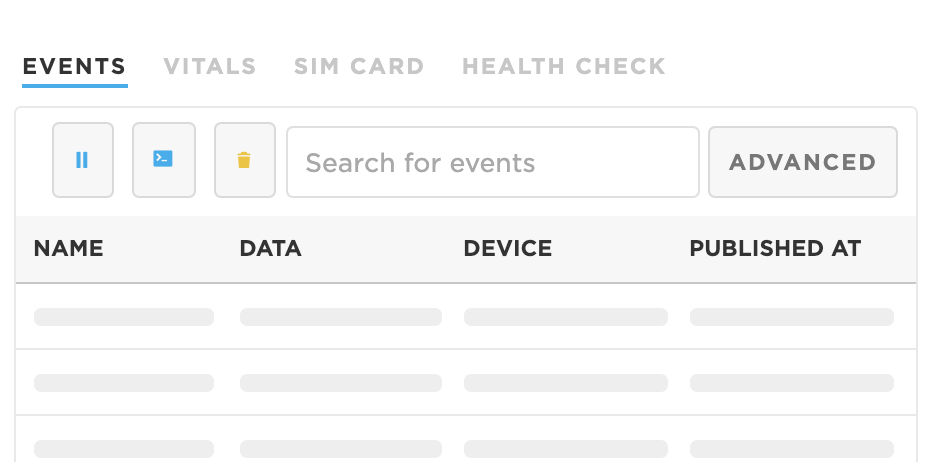
- If Events are being Published to your Terminal window after running the above, but they are not firing any Webhooks, it's time to check your Webhook's configuration. Ensure that the Event Name is specified correctly and that there are no formatting issues. Create a simplified test Integration that listens to the relevant Event and check for any differences in behavior.
- Finally, before opening a support ticket, ensure that Particle is not experiencing any degraded performance in our Webhook/Integrations infrastructure by visiting status.particle.io.
Understanding webhook errors
If instead of missing Webhooks, you are seeing errors (red marks on the History graph, see above), you can easily get to the root cause of those errors by following the instructions below. Take care to select the Errors menu:
Upon selecting "Errors" and then selecting a specific Error Event you will see the same formatting discussed above, Error Message, Event, Webhook Request, and Webhook Response. Look at both the Error Message and Webhook Response for the following Errors.
4xx Error codes (client error)
Error codes beginning with 4 (for example, the classic "404") indicate an error returned by your destination endpoint. These typically point to a malformed packet, an incorrectly formatted webhook message, or authentication/rate limit issues. For example:
- 400 - Bad Syntax (likely a simple error in your Webhook formatting)
- 401 or 403 - Permission Denied (likely an incorrect or incorrectly submitted authentication token)
- 404 - Not Found (likely a typo in your endpoint, or a change in your internal infrastructure that has changed the target endpoint destination)
- 429 - Too Many Requests (your infrastructure's rate limits have been exceeded, so they either need to be changed or you need to back off your request volume)
You can find more error codes here: (link).
5xx Error codes (server error)
Error codes beginning with 5 indicate an error returned on behalf of your server. These most often appear as 500 ("Server Error"), which generally means one of two things: your server is down, or your server is overloaded in some way. Investigate your server's health when you see 500s, taking the time to make basic requests to ensure it is responsive.
ETIMEDOUT
Unlike 4xx and 5xx errors, ETIMEDOUT denotes a very specific condition in which the server acknowledges the incoming request but fails to provide a response in time. Servers must return a response within a timeout period of 20 seconds.
There are two likely causes here: your server is overloaded with requests, or you are doing too much processing before producing a response (the general webhook paradigm understands that services should respond that they received a message before doing processing).
ESOCKETTIMEDOUTT
This signifies that the remote web server did initially accept the connection, but did not respond to the data we sent it.
read ECONNRESET
Conversely, for this error, your server endpoint is trying to connect but then abruptly closes the TCP connection. This can be due to protocol issues or timeout. This has been reported on Node.js and Azure endpoints.
Skipped events
Particle places no limitation on the rate at which a Webhook can be triggered by default. Therefore, ensure that the receiving server is capable of handling the request volume you are expecting to send. Failure to correctly calibrate in this regard will result in the 429 Error Code (see above).
However, when a server receiving Webhook requests fails many times in rapid successions, the Particle Device Cloud will start to skip sending some events to lighten the load on the receiving server. Specifically, Particle uses an adaptive algorithm to skip Webhook attempts when more 4xx or 5xx HTTP status codes than 2xx HTTP status codes are returned by the receiving server. After a cooldown period of a few seconds without errors, requests will be allowed to be made once again. Events that were skipped will retried after 30 seconds and 1 minute before being dropped.
As stated above, servers must return a response within the timeout period of 20 seconds. A server that does not respond within the timeout period will also count as a failed request, which could result in throttling of the traffic to that server. This is intended to prevent further overloading and overloaded server.
You will know events are being skipped if you see a hook-error event in your event stream that reads "Sleeping, too many errors, please wait and try again" in the body. You will also see grey bars in your History graph, identified as "skipped" events, corresponding to each event that has been throttled in this way.
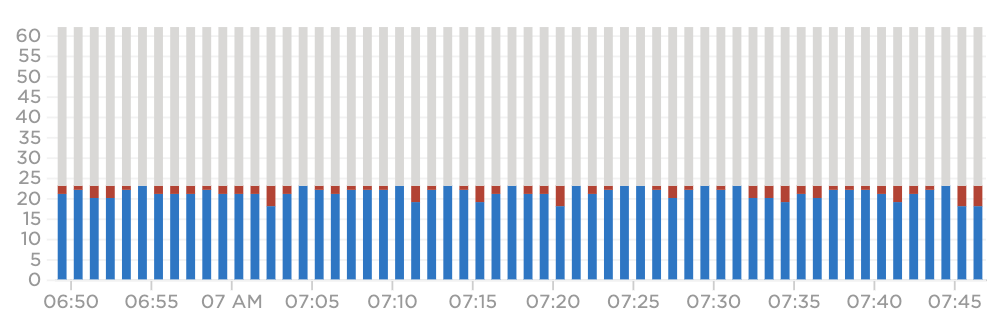
(grey bars indicating skipped events)
Integrations leading to high data operation consumption
An improperly configured webhook-response can accidentally lead to high Data Operation usage. If you have noticed that your Data Operation usage varies by whole number multiples of the frequencies with which a given webhoook fires, it's worth taking a closer look at the webhook response.
As above, scroll down to the "Logs" component of the webhook page:
At the above "Logs" section, click on any date time entry to expand the data payload and response. We are looking at the response here.
For webhooks, data is sent as 512 bytes per Publish. This means that a device that subscribes to a webhook response will receive a response in 512-byte chunks. A webhook response that consists of 5Kb of text data (e.g. a large chunk of HTML) will be sent as 10 Publish events, which equal 10 Data Operations. So - in short - if your devices subscribe to webhook responses, ensure your webhook responses are intentionally constructed and data-efficient!
Webhook/Integration debugging tools
For troubleshooting webhooks and integrations, consider these resources:
- Endpoint Testing Services: Utilize Beeceptor or RequestBin to verify your endpoint's functionality. These platforms capture webhooks and lets you review payloads, aiding in identifying any endpoint or infrastructure issues.
- API Client for Webhooks: Postman is a useful HTTP client for dispatching webhooks paylodas and receiving service response. Detailed guidance on Postman usage can be found here. For access token information, refer to the instructions here.
- JSON Formatting Check: Within the Particle Console, access 'Edit Integration' and 'Custom Template' to examine your JSON structure. For simpler evaluation, consider replacing with static values.
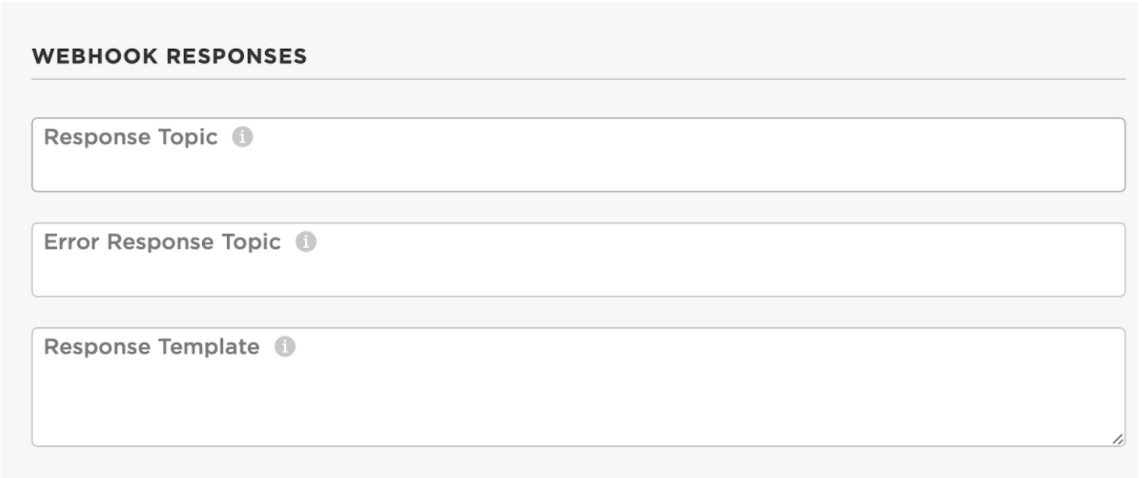
- Response Template Configuration: Enhance clarity by setting up a custom response template. This is done in the Webhook Builder under 'Advanced Settings', where you can specify a custom Response Topic/Template.
Opening a support ticket
The vast majority of Webhook-related issues reported to Particle ultimately are identified within the above document. If you suspect that you are experiencing an edge case issue related to Particle's infrastructure, please first go to status.particle.io to check if an outage is occurring. After doing so, please open a ticket with the following information:
- Webhook Name or ID
- Webhook Parent User and/or Product
- Specific Time Period of Failed and/or Missing Requests
- Specific Error Codes Received in Your Integrations Logs -
- Critical: since we do only log the last 10 successes and errors, please take screenshots of any fully-expanded Errors from the Console page (see above).
- Specific DeviceIDs and Event Names (in the case of missing requests)