


 Go to console

 Change theme


 Edit Account
 Logout
Device vitals
Device Vitals are indicators that impact the overall health of a device. This is useful when troubleshooting connectivity issues for specific devices deployed in the field.
Device vitals are:
- Collected by every Particle device: The device records information relevant to its ability to successfully connect and communicate with the Device Cloud.
- Sent to the Device Cloud: Vitals are automatically shared with the Device Cloud when starting a new session, and can be sent on demand or periodically using Particle.publishVitals, below, from device firmware.
- Accessible via the Console or API: The Console exposes a Vitals Dashboard as well as the last recorded vitals. This information can also be queried via Particle's Device Cloud API.
Device Vitals can be used in-tandem with Fleet Health for a bird's eye view of your IoT system's health.
In view device
When you are viewing the device list for a product, click on a row for a specific device to open the device view.
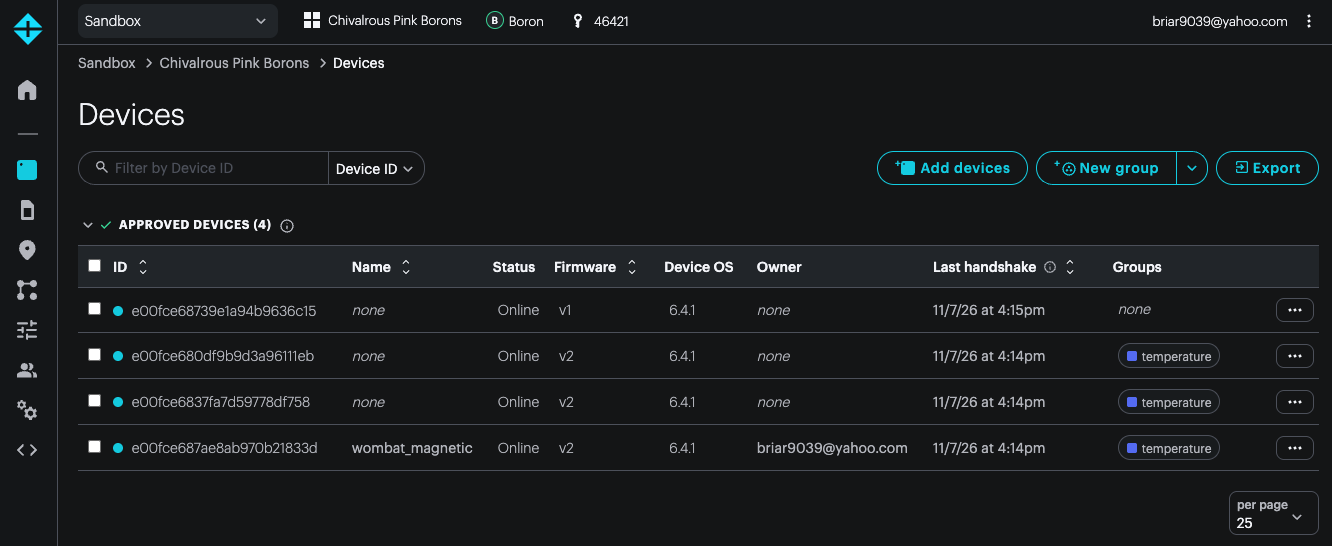
Device vitals information is available in two locations in this view:
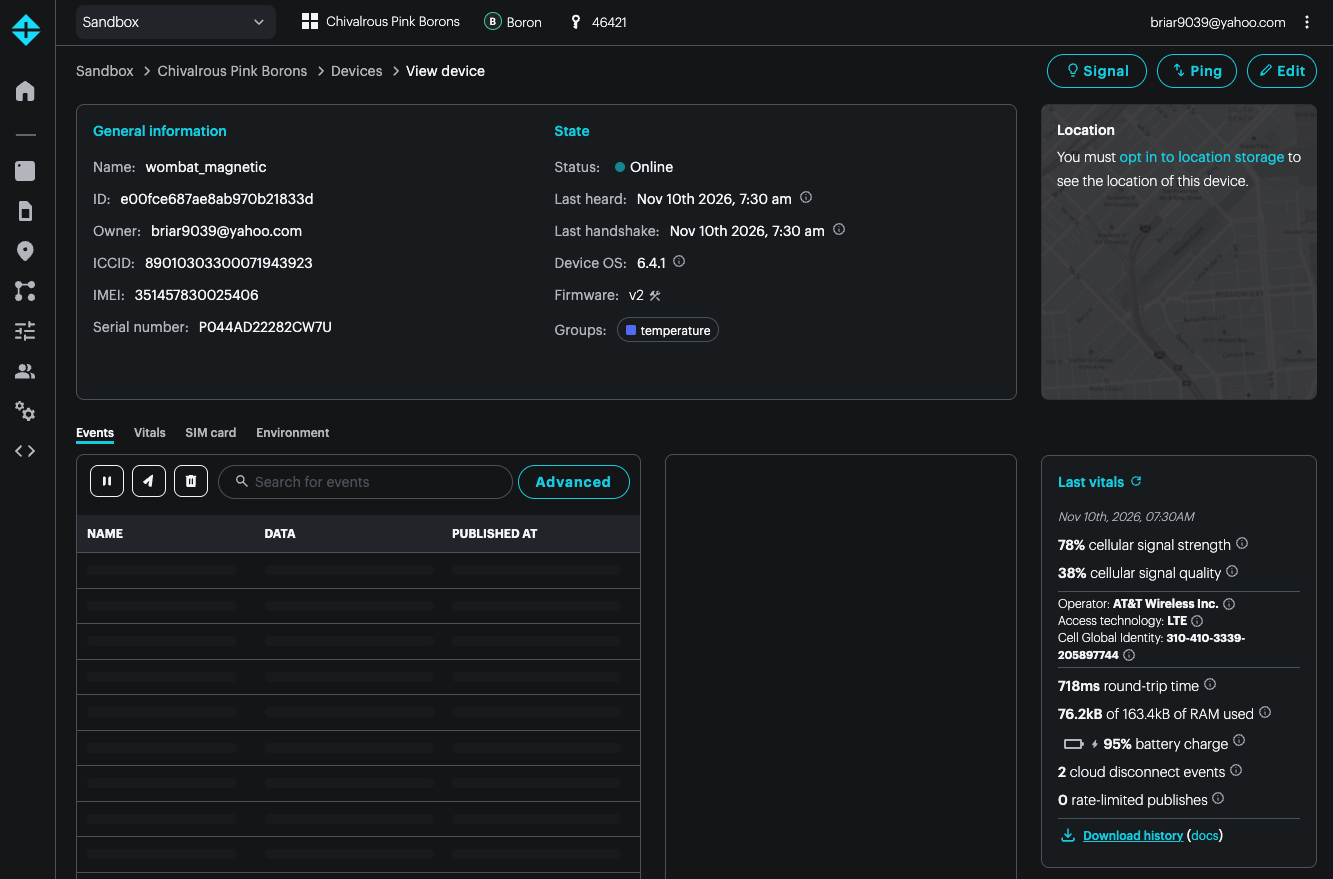
Last vitals
This panel shows the last device vitals information sent by the device.
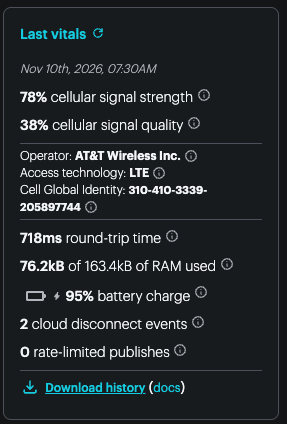
- The control to the right of Last vitals requests the device send new vitals information, if it's online.
- The Download history downloads historical vitals information for this device for the last 30 days as a .csv file.
Hovering over the i icon displays help information for the field.
Vitals
The Vitals panel in the middle (next to Events) shows device health information for a single device. You can choose the time-frame as well.
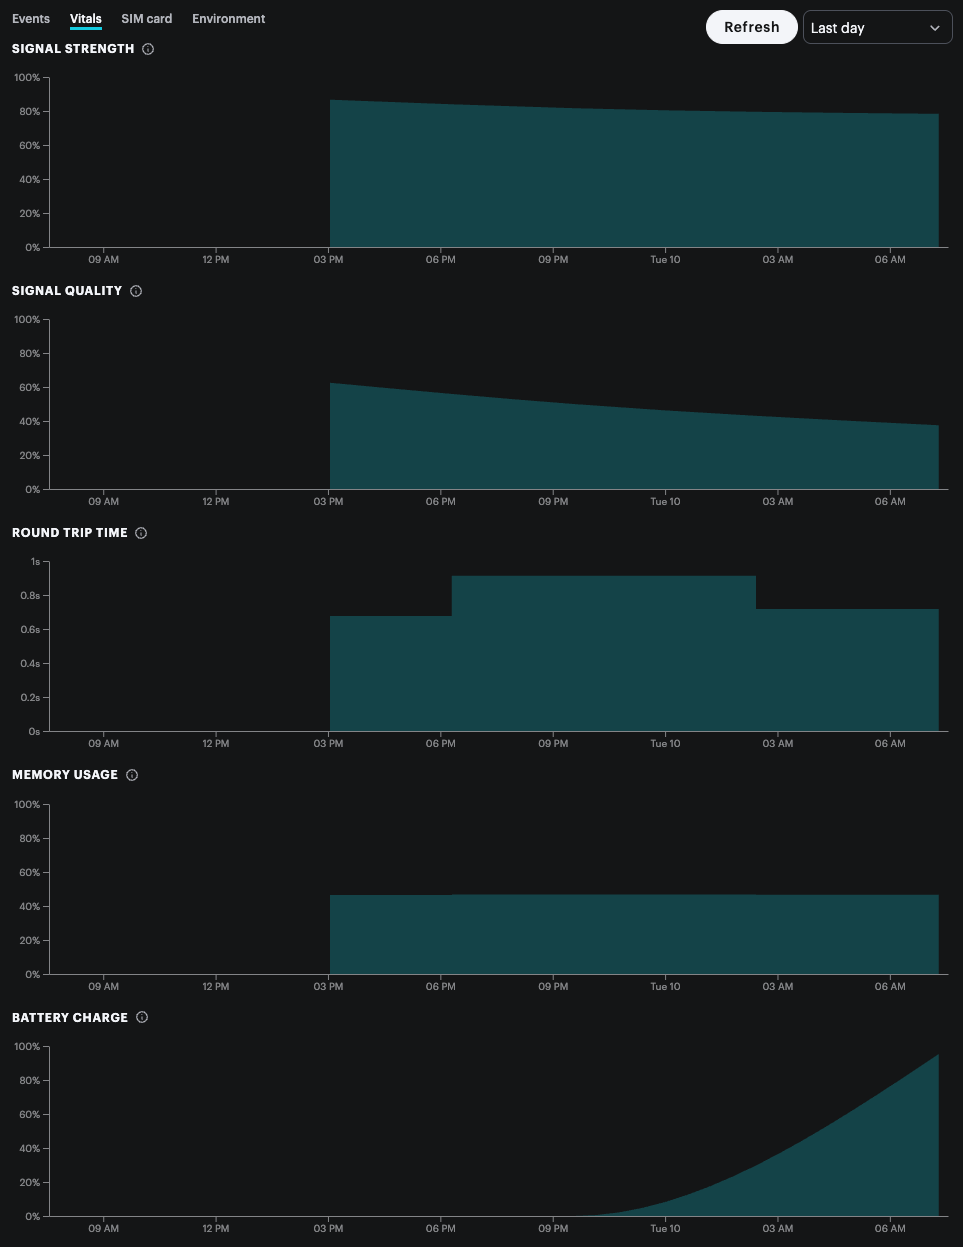
Signal strength
The strength of the device’s connection to the network, measured in decibels of received signal power. Both signal strength and quality impact the health of the connection.
In the download, this is the device.network.signal.strength column.
Signal quality
Like signal strength, quality is also normalized as a percentage from 0-100 — the closer to 100, the higher the quality. As a rule of thumb, the fewer devices in close proximity communicating using similar radio frequencies, the better signal quality will be. Raw signal quality is available on the tooltip displayed when hovering over a vitals data point.
In the download, this is the device.network.signal.quality column.
Round trip time
A longer round-trip time often correlates with poor signal strength or quality. Round trip time is displayed in seconds — the lower the reported time, the better the performance.
Note that only messages sent by the Device Cloud to the device like event subscriptions, function calls and variable requests are counted in the round-trip time so if a device is only sending data to the cloud through event publishes the round-trip time won't update.
In the download, this is the service.coap.round_trip column.
Memory usage
The amount of memory used by the device, combining the heap and the user application’s static RAM in bytes.
In the download, this is the device.system.memory.used column.
We strongly recommend leaving a minimum of 10K of available RAM at all times to assure proper operation of the system. See out of memory handler in Code Size Tips for more information.
Battery charge
The state of charge of the device’s connected battery, represented as a percentage.
In the download, this is the device.power.battery.charge column.
If the battery charge falls too low, the device is at risk of losing power and going offline. Battery charge is displayed as a percentage from 0-100% — the closer to 100, the more charge is available to the battery.
Only devices that contain a fuel gauge chip report the battery state. This includes:
- Boron
- Tracker SoM and Tracker One
- Monitor One
- E-Series
- Electron
A fuel gauge (MAX17043) is optional on:
- B-SoM (if included on your base board)
- M-SoM (if included on your base board)
It is not available on:
- P2, Photon 2
- Argon
- P1, Photon 1
Data resolution
Device Vitals are bucketed into varying time intervals depending on which time range is selected in the Console:
- Last hour — 1 minute intervals
- Last day — 15 minute intervals
- Last 2 days — 30 minute intervals
- Last week — 2 hour intervals
- Last 2 weeks — 4 hour intervals
- Last 30 days — 8 hour intervals
Error codes
Error codes in device.cloud.connection.error are described in comm.protocol errors.
Sending vitals to device cloud
There are a few different ways that a device can be instructed to send its vitals to the Device Cloud.
- Starting a secure session: When a device handshakes with the Device Cloud, it will automatically collect and send its vitals recorded at startup.
- Particle.publishVitals(): An API in Device OS allows you to instruct a device to send its vitals in application firmware.
- Refreshing from the Device Cloud: Remotely trigger a device to send its vitals ad hoc via the Console or the Device Cloud API.
The device delivers the diagnostics data to the Particle Device Cloud
via the spark/device/diagnostics/update
system event. The device vitals event will include a data payload of the
most recent readings the device collected.
Particle.publishVitals()
Particle.publishVitals() is a method exposed by Device OS as of
version 1.2.1. It allows you to collect and send device vitals on a
regular cadence as part of application firmware.
This is especially
useful if you use the Device Vitals historical graphs in the Console,
and want regular intervals of data for analysis. For instance, to publish
vitals every hour, add the following to your setup() function:
void setup() {
  Particle.publishVitals(3600);
}

void loop() {
  // Your loop logic goes here
}
publishVitals() accepts one optional argument, which is the period (in
seconds) at which vitals are to be sent to the cloud. If you don't pass
an argument, vitals will be published once, immediately.
For the full reference docs on Particle.publishVitals(), click
here.
Note: You should take care when determining how often devices should send their vitals to the Device Cloud. There's a trade off to be made: The more frequently you send the vitals, the higher fidelity of data available to you when troubleshooting. But, this comes with an increase in cellular data usage (Each vitals message is ~150 bytes). You can find the proper balance for your specific needs. A good starting point is every 6 hours, 4 times per day, or 21600 seconds.
Advanced vitals publishing
The technique above is useful in most cases, but if you want a bit more control over when the device vitals are published you can use a technique such as this:
#include "Particle.h"

SYSTEM_MODE(AUTOMATIC);
#ifndef SYSTEM_VERSION_v620
SYSTEM_THREAD(ENABLED); // System thread defaults to on in 6.2.0 and later and this line is not required
#endif

SerialLogHandler logHandler(LOG_LEVEL_INFO);

const std::chrono::seconds vitalsPeriod = 6h; // How often to publish vitals
retained time_t vitalsTimeNext = 0; // Time (UTC) of next vitals publish

void setup() {
}

void loop() {
    if (Particle.connected() && Time.isValid()) {
        if (vitalsTimeNext == 0 || vitalsTimeNext > (Time.now() + vitalsPeriod.count())) {
            vitalsTimeNext = Time.now() + vitalsPeriod.count();
        }
        if (Time.now() > vitalsTimeNext) {
            Particle.publishVitals(particle::NOW);
            vitalsTimeNext = Time.now() + vitalsPeriod.count();
        }
    }
}
Refresh using the API
If you'd like to programmatically instruct the device to re-send its device vitals, you can use the Device Cloud REST API. This is especially useful if you'd like to automate devices in your fleet reporting diagnostic information on a regular cadence.
You will need to make a POST request to the refresh device
vitals API endpoint, then listen for the
published event from the device either using the server-sent event
stream or by
setting up a webhook that
triggers off of the spark/device/diagnostics/update event.